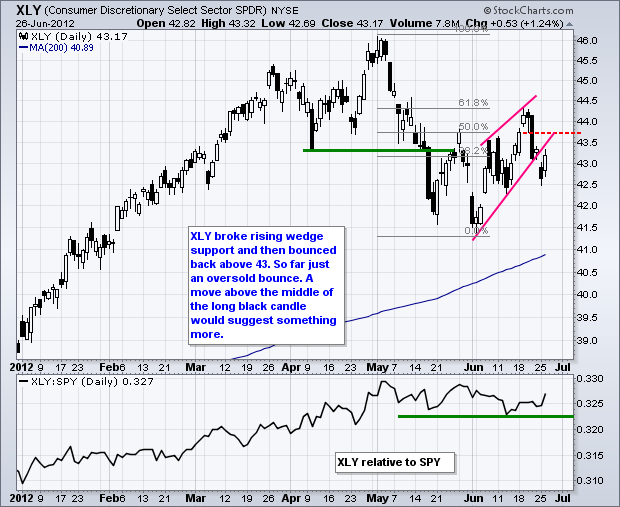
Stocks got an oversold bounce on Tuesday with the S&P MidCap 400 SPDR (MDY) leading the way. The gains, however, were quite modest with MDY up just .67% and the S&P 500 ETF (SPY) edging higher by .50%. Nothing to write home about for sure. Stocks are probably treading water head of the healthcare ruling. All sectors were up with the Consumer Discretionary SPDR (XLY) and Energy SPDR (XLE) leading the way. Both gained over 1%. XLY has been one of the more resilient sectors this year, but I am not ready to write off the rising wedge break just yet.
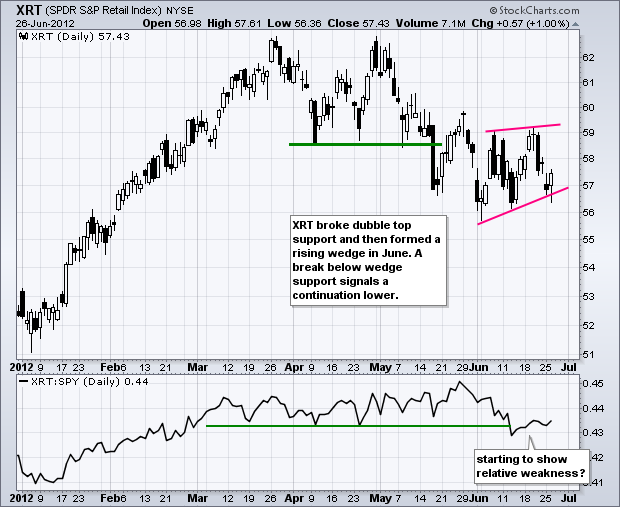
Retail sales is one of the most important economic indicators and the health of the retail industry is reflected in the Retail SPDR (XRT), which is a broad based ETF with over 100 retail stocks. There was a clear breakdown in May and then a consolidation in June. I am treating this as a consolidation within a downtrend. A move above the June highs would suggest otherwise.
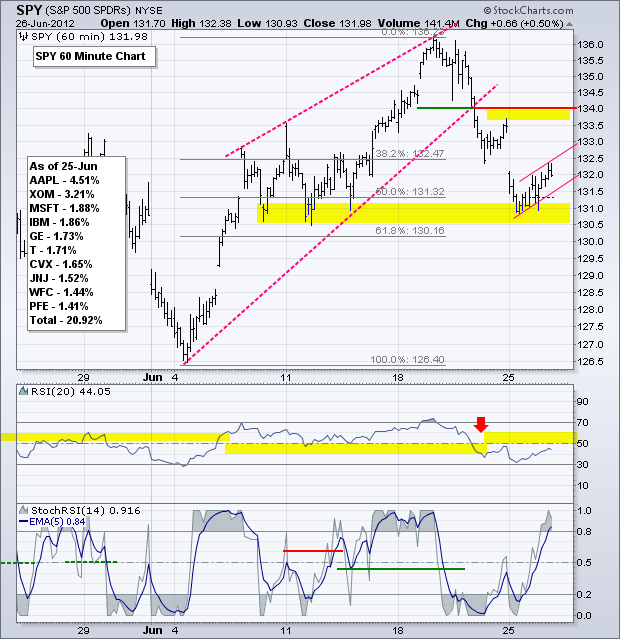
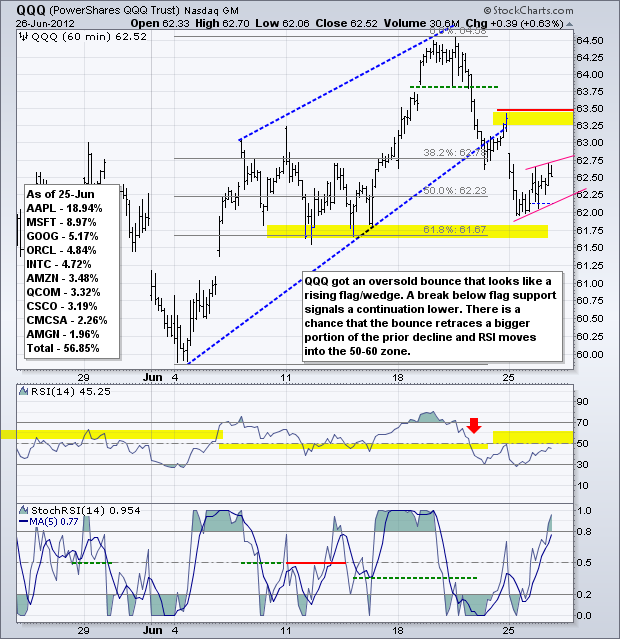
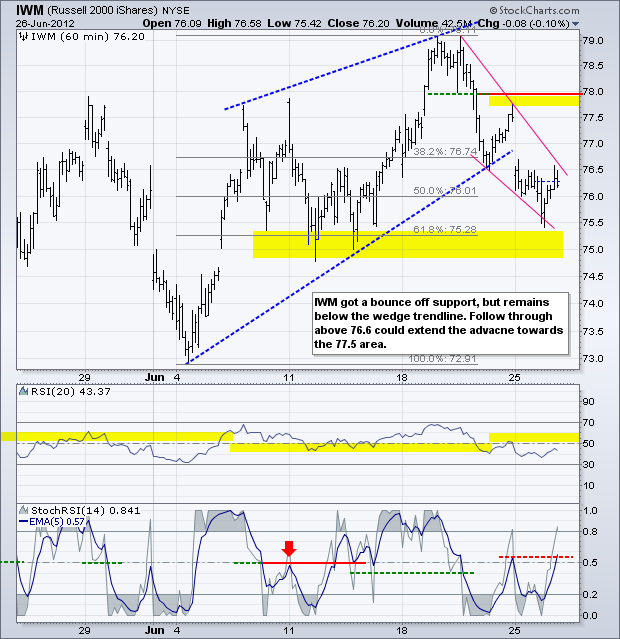
After plunging from 136 to 131, the S&P 500 ETF got an oversold bounce back towards 132 the last two days. A small rising flag could be taking shape and a break below flag support would signal another continuation lower. The 5-period EMA of StochRSI pushed above .80 to become overbought. Keep in mind that this is a super sensitive momentum indicator used for the very short-term. StochRSI measures the momentum of RSI. A move back below .40 would signal a downturn in the momentum of momentum (RSI). The wild card is a positive reaction to the healthcare ruling, which could push the ETF towards broken support in the 133.5-134 area and RSI into the 50-60 zone.
**************************************************************************
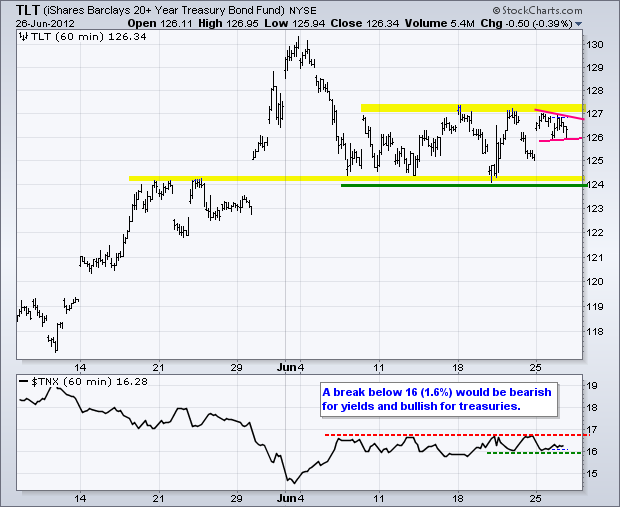
The 20+ Year T-Bond ETF (TLT) is just waiting for the bout of stock market weakness or global uncertainty. TLT traded up to resistance and then consolidated with a pennant type formation. A break above pennant resistance would signal a continuation higher and this could be negative for stocks. Failure to break resistance and a move back to support would be positive. A support break at 124 would be very bullish for stocks, but we have yet to see even a step in that direction.
**************************************************************************
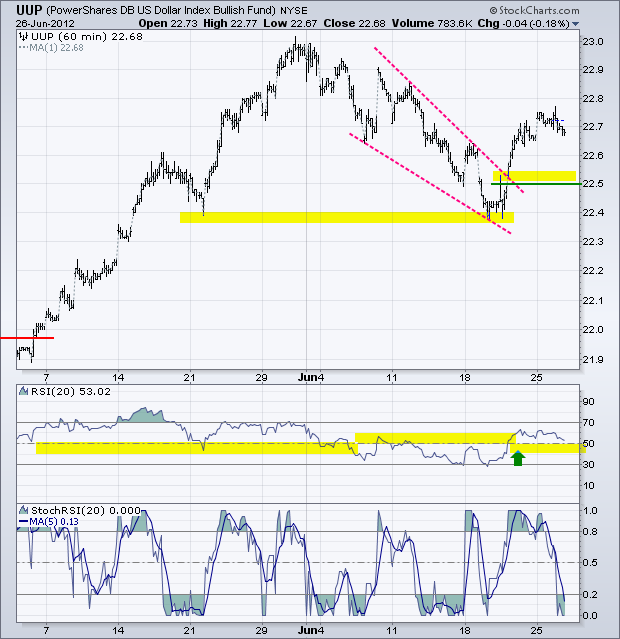
Is anyone bullish on the Euro? Being the short the Euro is definitely a crowded trade, but EU officials are not giving the bears reason to doubt their stance. The EU summit starts tomorrow and expectations are low, but any positives could trigger a short-covering rally. Most likely, we will see more muddling through until Greece's next debt payment, which is due to the European Central Bank (ECB) in August. The US Dollar Fund (UUP) broke resistance and is holding this breakout. Broken resistance turns first support in the 22.50 area.
**************************************************************************
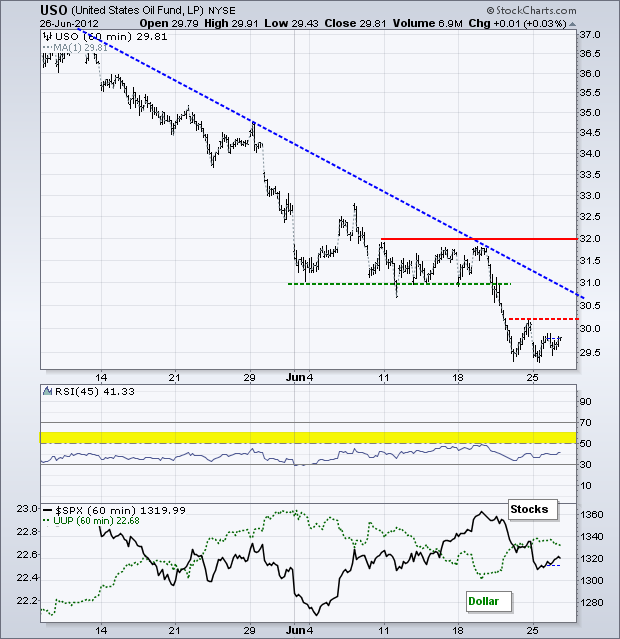
The US Oil Fund (USO) firmed along with the stock market and Euro over the last two days (after Monday's open). These three are joined at the hip and should continue moving together. USO established minor resistance with Friday's high and a break would argue for an oversold bounce towards the June consolidation.
**************************************************************************
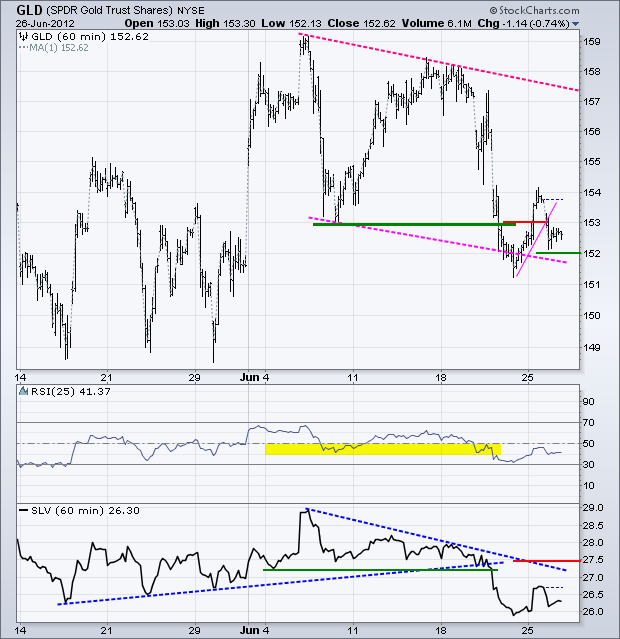
The Gold SPDR (GLD) took it on the chin Tuesday with a break back below 153. The trend since August 2011 is down for gold with a large descending triangle taking shape. The trend since the June high is also down with a lower high and lower low. The bounce back above 153 did not last long and GLD could be poised for a continuation of last week's plunge. This means another big support test around 149.
**************************************************************************
Key Reports and Events:
Wed - Jun 27 - 08:30 – Durable Goods Orders
Wed - Jun 27 - 10:00 - Pending Home Sales
Wed - Jun 27 - 10:30 - Oil Inventories
Thu - Jun 28 - 08:30 – Initial Jobless Claims
Thu - Jun 28 - 08:30 – GDP
Thu - Jun 28 - 08:30 – Supreme Court Healthcare Ruling?
Thu - Jun 28 – 08:30 – 2-day EU Summit Begins
Fri - Jun 29 - 08:30 - Personal Income & Spending
Fri - Jun 29 - 09:45 - Chicago Purchasing Managers Index (PMI)
Fri - Jun 29 - 09:55 - Michigan Sentiment
Fri - Jun 29 - 12:00 – 2-day EU Summit Ends
Thu - Jul 05 - 10:00 – European Central Bank Policy Statement
Charts of Interest: Tuesday and Thursday
This commentary and charts-of-interest are designed to stimulate thinking. This analysis is not a recommendation to buy, sell, hold or sell short any security (stock ETF or otherwise). We all need to think for ourselves when it comes to trading our own accounts. First, it is the only way to really learn. Second, we are the only ones responsible for our decisions. Think of these charts as food for further analysis. Before making a trade, it is important to have a plan. Plan the trade and trade the plan. Among other things, this includes setting a trigger level, a target area and a stop-loss level. It is also important to plan for three possible price movements: advance, decline or sideways. Have a plan for all three scenarios BEFORE making the trade. Consider possible holding times. And finally, look at overall market conditions and sector/industry performance.

About the author:
Arthur Hill, CMT, is the Chief Technical Strategist at TrendInvestorPro.com. Focusing predominantly on US equities and ETFs, his systematic approach of identifying trend, finding signals within the trend, and setting key price levels has made him an esteemed market technician. Arthur has written articles for numerous financial publications including Barrons and Stocks & Commodities Magazine. In addition to his Chartered Market Technician (CMT) designation, he holds an MBA from the Cass Business School at City University in London.
Learn More


