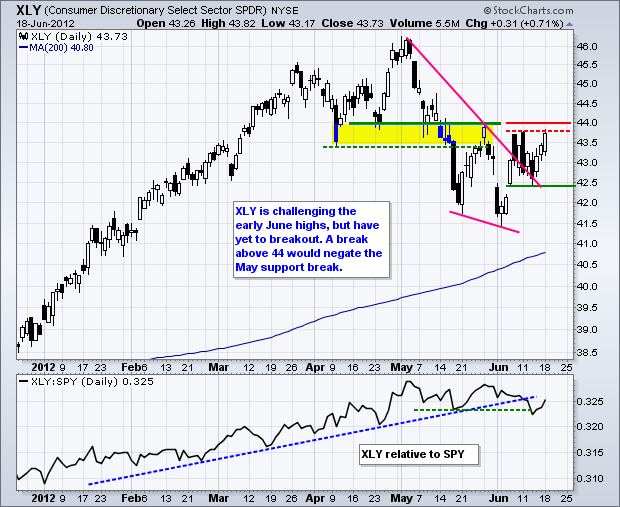
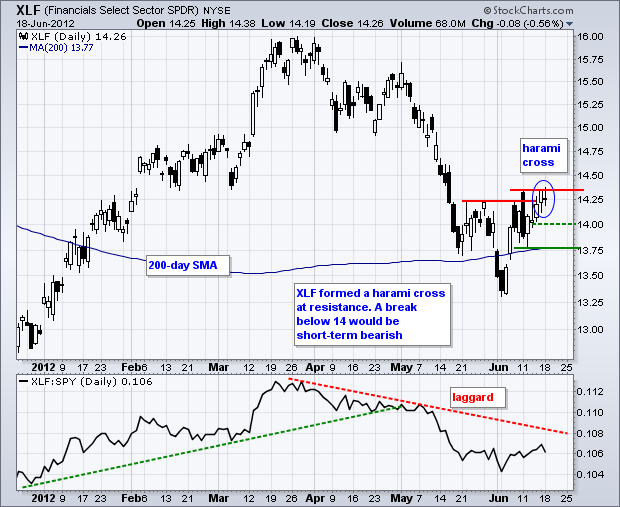
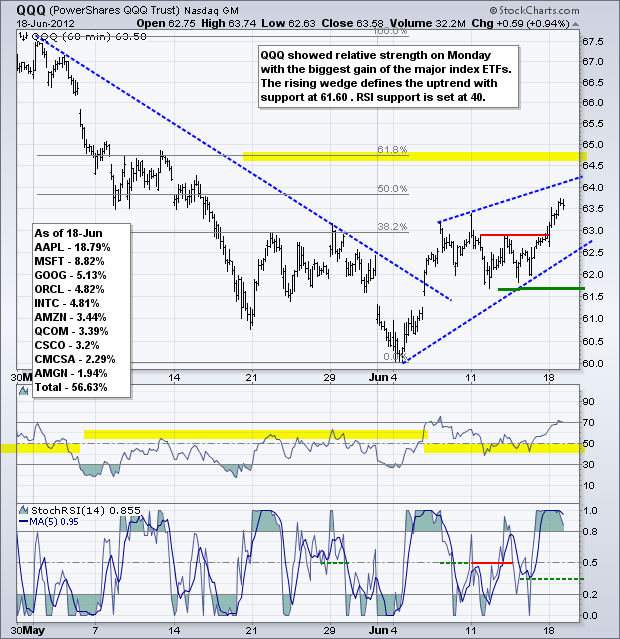
It was a mixed day for stocks with the Dow Industrials SPDR (DIA) moving lower and the Nasdaq 100 ETF (QQQ) moving higher. The market was weighed down by the Finance SPDR (XLF) and Energy SPDR (XLE), but lifted by the Technology SPDR (XLK) and the Consumer Discretionary SPDR (XLY). Given the choice, I would much rather see leadership from the technology and consumer discretionary sectors. Despite a three day move in both, XLK and XLY are near resistance levels and have yet to complete short-term breakouts.
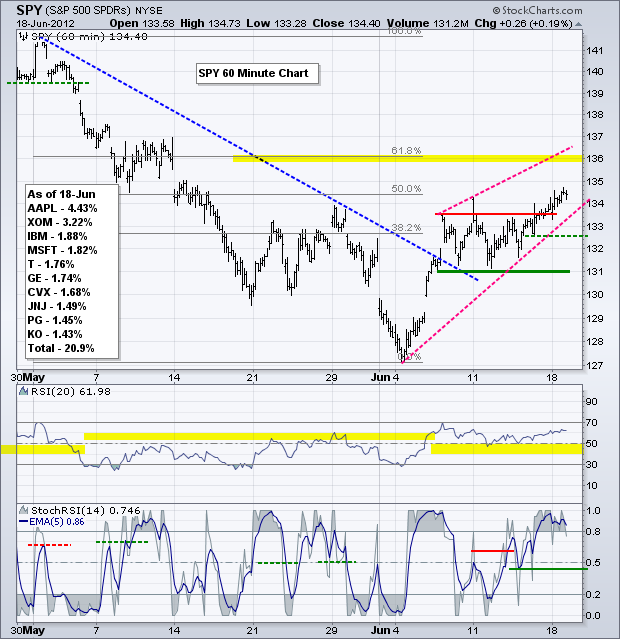
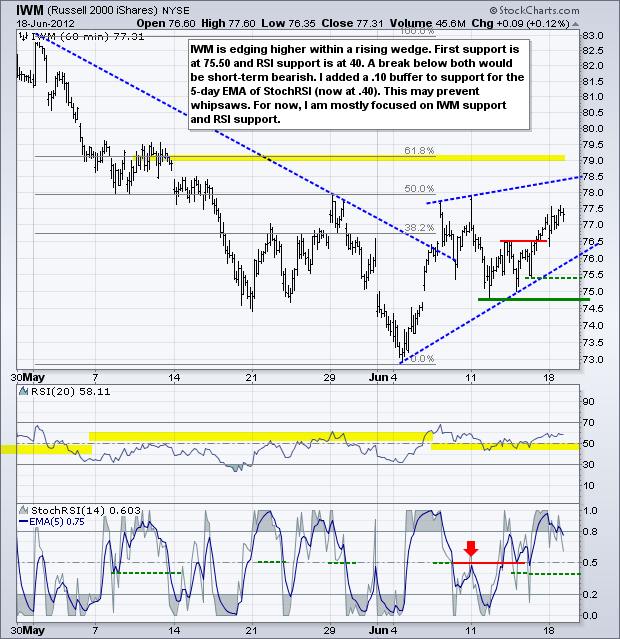
On the 60-minute chart, the SPY bulls are in good shape as long as this wedge rises. Trading is going to get real tricky the next two days because the Fed starts its two day meeting today, makes its policy statement at 12:30PM Wednesday and then holds a news conference. Talk about dragging it out! In any case, the short-term trend is up with first support marked at 132.50. I am concerned that this support level is too tight and some Fed-induced volatility might create a whipsaw. Therefore, I would look for RSI to confirm a support break with a move below 40. Keep in mind that this is based on the 60 minute chart and closing prices at the end of each 60 minute period.
**************************************************************************
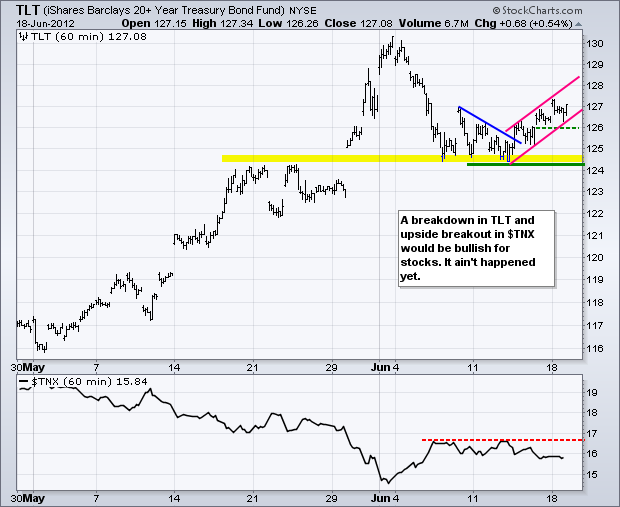
Treasuries will be on the hot seat as well over the next two days. The flight to safety trade remains in place as investors fret over the Spanish banks. Also note that German bunds have declined in June and may be loosing their safe haven appeal. The 20+ Year T-Bond ETF (TLT) bounced off support and edged higher the last four days. This is a short-term uptrend within a medium-term uptrend. Key support is set at 124.
**************************************************************************
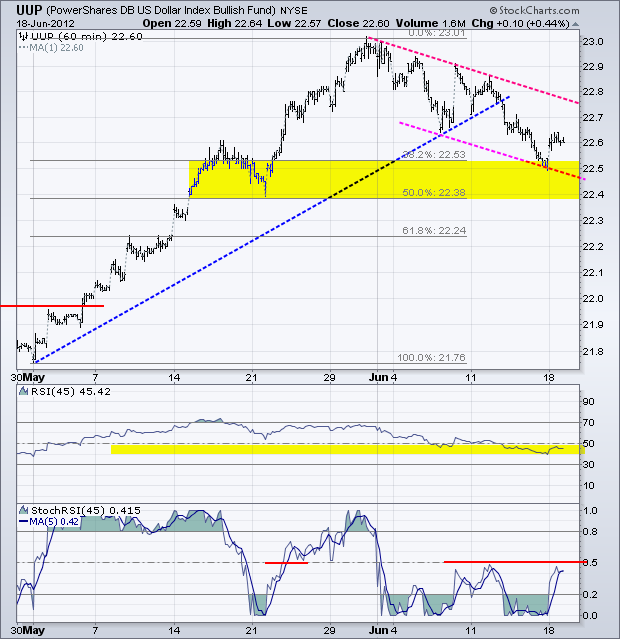
Greece is on the verge of forming a government, but the Euro slips and the US Dollar Fund (UUP) bounces off channel support. UUP retraced around 38.2% of the May advance with a zigzag down in June. This looks like a correction and the bounce off the lower trendline is the first sign that this correction is ending. Trendline resistance at 22.8 is the next bullish hurdle. I adjusted RSI to 45 periods so it holds the 40 level on this decline. Of course, this assumes that the decline was a correction and is ending soon. The 5-day EMA of StochRSI has been below .50 since the correction and a break above this level would be bullish for momentum.
**************************************************************************
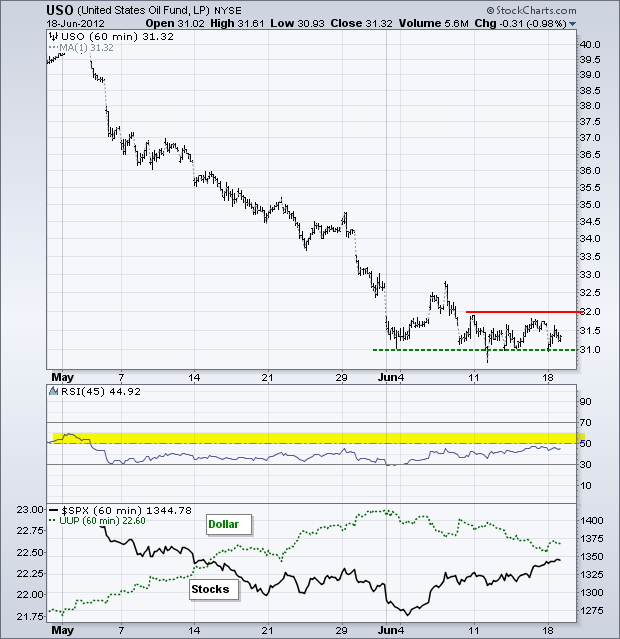
The Dollar fell in June and stocks rose, but oil remained flat. The US Oil Fund (USO) reached 31 at the beginning of June and remained near this 31 level most of the month. Is it a base? A successful base requires a breakout and we can set resistance at 32. RSI resistance is set at 60. The Spot Light Crude ($WTIC) equivalent is $82 and a breakout at $86 would be short-term bullish.
**************************************************************************
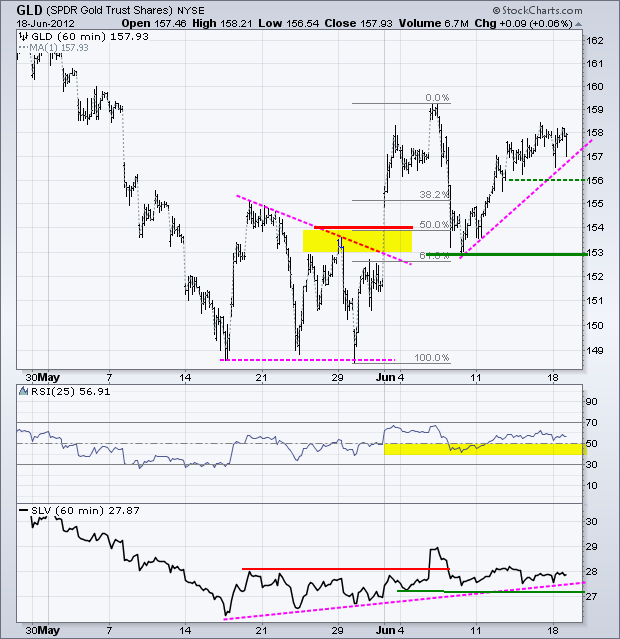
No change. The Gold SPDR (GLD) moved higher last week and is challenging its early June high. At this point, gold seems to benefit from the risk-on trade. Strength in oil, the Euro and stock market benefit gold. A return to the risk-off trade would be negative for bullion. I am marking first support at 156. A break below this level would argue for another test of key support at 153.
**************************************************************************
Key Reports and Events:
Mon - Jun 18 - 10:00 – G20 Summit in Mexico – Ole!
Mon - Jun 18 - 10:00 - NAHB Housing Market Index
Tue - Jun 19 - 08:30 - Housing Starts/Building Permits
Wed - Jun 20 - 17:00 – Greek Coalition Formation Deadline
Wed - Jun 20 - 07:00 - MBA Mortgage Index
Wed - Jun 20 - 10:30 - Oil Inventories
Wed - Jun 20 - 12:30 – FOMC Policy Statement
Thu - Jun 21 - 08:30 – Supreme Court Healthcare Ruling?
Thu - Jun 21 - 08:30 - Initial Claims
Thu - Jun 21 - 10:00 - Existing Home Sales
Thu - Jun 21 - 10:00 - Philadelphia Fed
Thu - Jun 21 - 10:00 - Leading Economic Indicators
Thu - Jun 21 - 10:00 – Consultant's Report on Spanish Banks?
Fri - Jun 22 - 10:00 – Merkel, Hollande, Rajoy and Monti Meet
Mon - Jun 25 - 08:30 – Supreme Court Healthcare Ruling?
Sun - Jun 28 - 10:00 – 2-day EU Summit
Thu - Jul 25 - 10:00 – European Central Bank Policy Statement
Charts of Interest: Tuesday and Thursday
This commentary and charts-of-interest are designed to stimulate thinking. This analysis is not a recommendation to buy, sell, hold or sell short any security (stock ETF or otherwise). We all need to think for ourselves when it comes to trading our own accounts. First, it is the only way to really learn. Second, we are the only ones responsible for our decisions. Think of these charts as food for further analysis. Before making a trade, it is important to have a plan. Plan the trade and trade the plan. Among other things, this includes setting a trigger level, a target area and a stop-loss level. It is also important to plan for three possible price movements: advance, decline or sideways. Have a plan for all three scenarios BEFORE making the trade. Consider possible holding times. And finally, look at overall market conditions and sector/industry performance.

About the author:
Arthur Hill, CMT, is the Chief Technical Strategist at TrendInvestorPro.com. Focusing predominantly on US equities and ETFs, his systematic approach of identifying trend, finding signals within the trend, and setting key price levels has made him an esteemed market technician. Arthur has written articles for numerous financial publications including Barrons and Stocks & Commodities Magazine. In addition to his Chartered Market Technician (CMT) designation, he holds an MBA from the Cass Business School at City University in London.
Learn More
