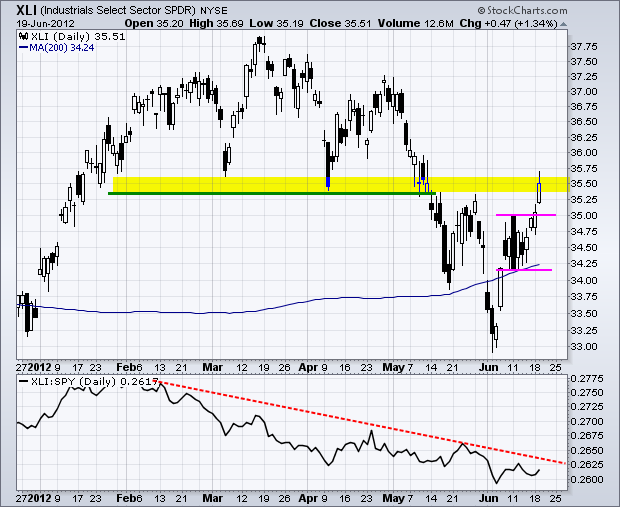
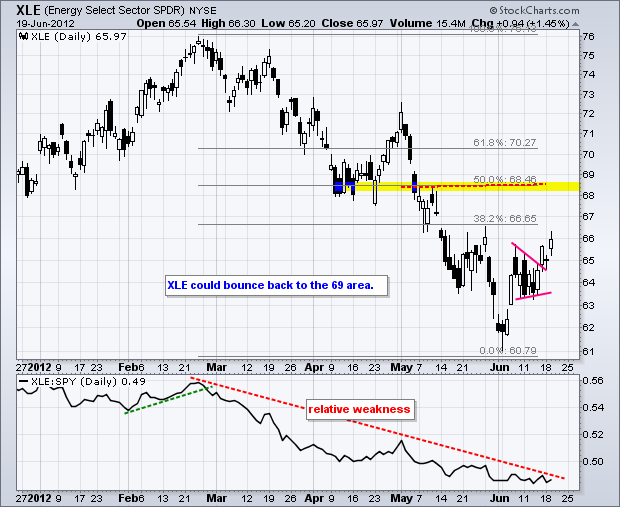
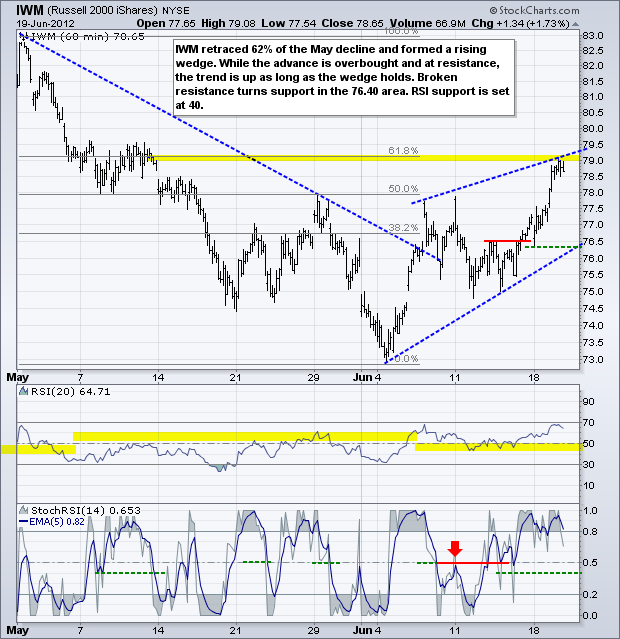
Stocks moved higher again on Tuesday, but performance was lopsided again. The Russell 2000 ETF (IWM) led the market with a 1.73% gain, but the S&P 100 ETF (OEF) lagged with a .37% gain. Seven of the nine sectors were up. Money moved out of the Consumer Staples SPDR (XLP) and Utilities SPDR (XLU) as both closed lower. These funds found there way into the Industrials SPDR (XLI), Energy SPDR (XLE), Finance SPDR (XLF) and Basic Materials SPDR (XLB), all of which gained over 1.3%. With these gains, XLI broke resistance and is now challenging broken resistance. XLE broke pennant resistance.
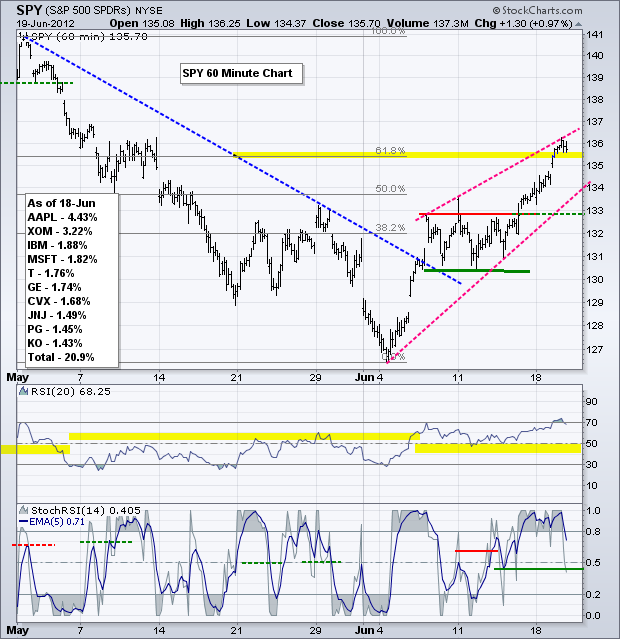
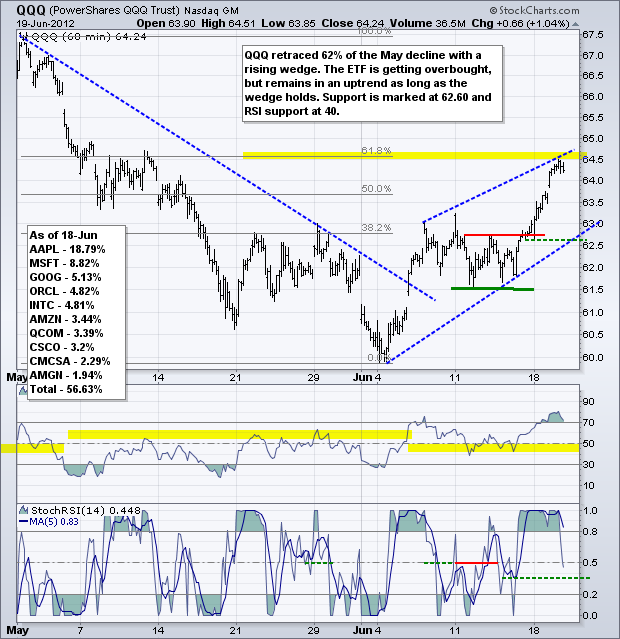
On the 60-minute chart, SPY surged above 135 and has now retraced 61.80% of the May decline. The trend is clearly up as long as SPY holds the rising wedge, but this advance is getting long on tooth as it hits the 61.80% retracement line. Broken resistance turns into first support in the 133 area. RSI support is set at 40. Note that all three major index ETFs are at their moment-of-truth (61.80% retracement lines). The Fed meets today with an announcement set for 12:30 and a presser at 14:30. The market has build in some high expectations so the Fed better deliver.
**************************************************************************
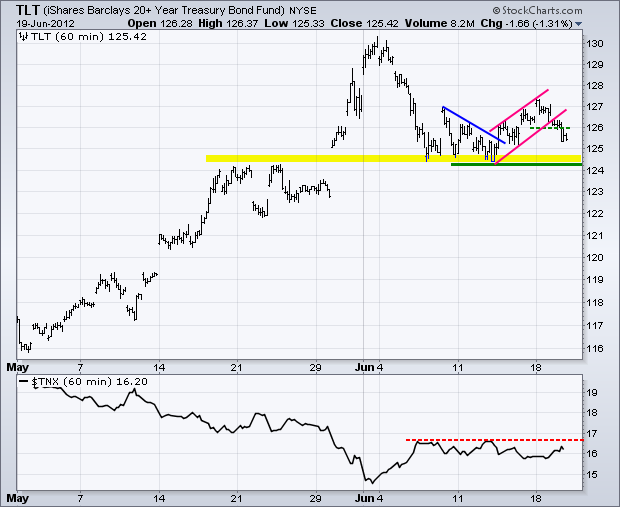
The TLT is also at its moment-of-truth. TLT broke support from the small rising channel, but remains above key support from the June lows. A support break would be quite bearish for treasuries and bullish for stocks. Also note that, a 10-year Treasury Yield ($TNX) break above 1.7% would be bullish for stocks. I do not think stocks can continue their big risk off move without a little help from treasuries.
**************************************************************************
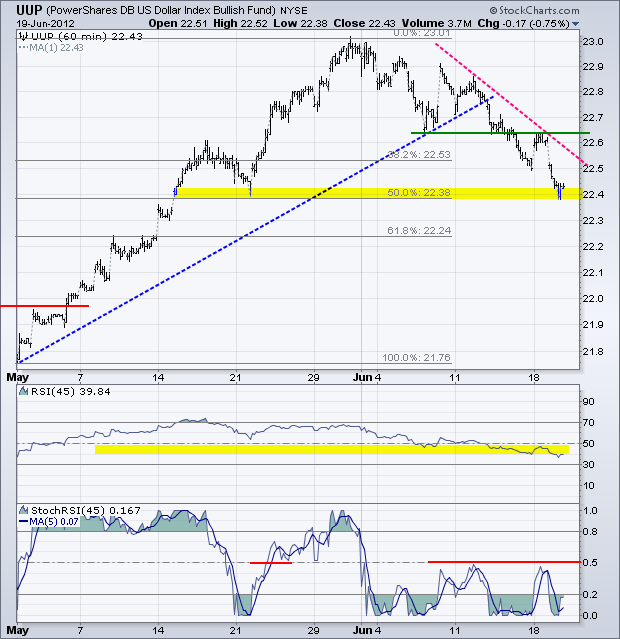
The US Dollar Fund (UUP) popped on Monday and then dropped to now lows for the month on Tuesday. Sentiment has clearly swung against the Dollar this month. Even though this is thought to be a correction, it is overstaying its welcome and any positive news out of Europe could push UUP even lower. Do not be surprised to see some sort of banking union announced at the EU summit at the end of the month. The market could be price this in with further gains in the Euro over the next week or so. With this decline, UUP established a clear resistance level at Monday's high. StochRSI resistance is set at .50. Watch these levels for a breakout.
**************************************************************************
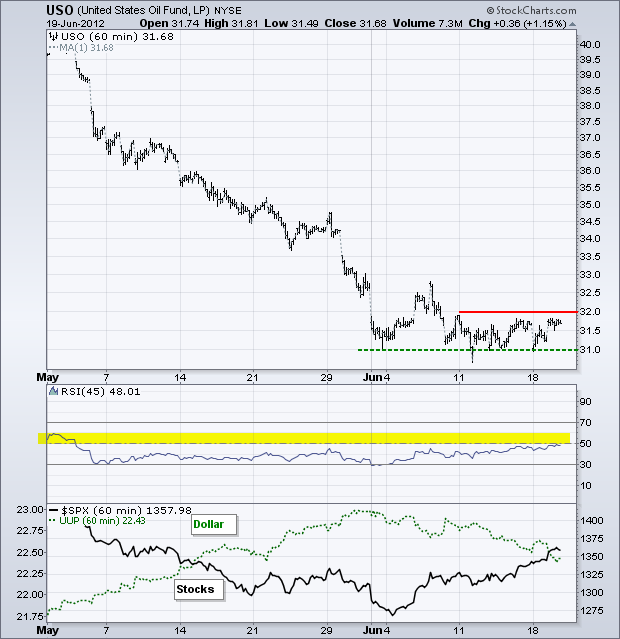
The Dollar continues to fall and stocks continue to rise, but the US Oil Fund (USO) has yet to break above its mid June highs. Spot Light Crude ($WTIC) also remains below these highs. USO moved into a tight range the last week and a half. A break above 32 would be short-term bullish. A support break in TLT would likely facilitate a resistance break in USO. The failure to breakout is putting a damper on energy stocks. A breakout in USO would likely unleash some powerful moves in XLE and XES.
**************************************************************************
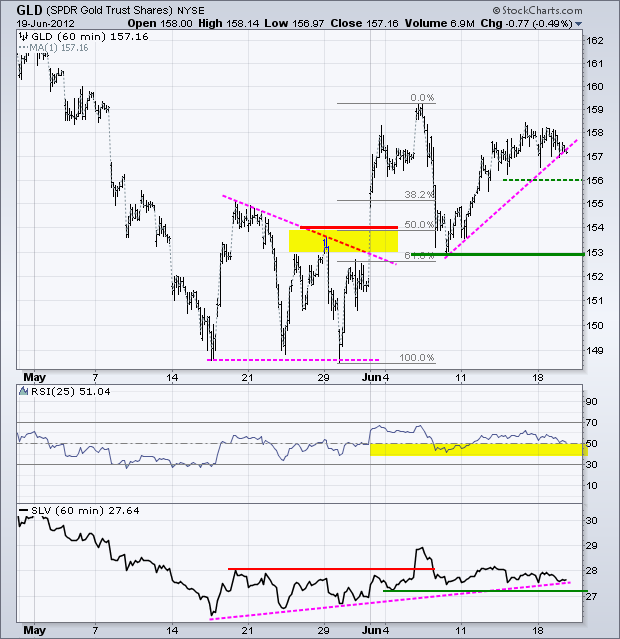
No change. The Gold SPDR (GLD) moved higher last week and is challenging its early June high. At this point, gold seems to benefit from the risk-on trade. Strength in oil, the Euro and stock market benefit gold. A return to the risk-off trade would be negative for bullion. I am marking first support at 156. A break below this level would argue for another test of key support at 153.
**************************************************************************
Key Reports and Events:
Wed - Jun 20 - 17:00 – Greek Coalition Formation Deadline
Wed - Jun 20 - 07:00 - MBA Mortgage Index
Wed - Jun 20 - 10:30 - Oil Inventories
Wed - Jun 20 - 12:30 – FOMC Policy Statement
Thu - Jun 21 - 08:30 – Supreme Court Healthcare Ruling?
Thu - Jun 21 - 08:30 - Initial Claims
Thu - Jun 21 - 10:00 - Existing Home Sales
Thu - Jun 21 - 10:00 - Philadelphia Fed
Thu - Jun 21 - 10:00 - Leading Economic Indicators
Thu - Jun 21 - 10:00 – Consultant's Report on Spanish Banks?
Fri - Jun 22 - 10:00 – Merkel, Hollande, Rajoy and Monti Meet
Mon - Jun 25 - 08:30 – Supreme Court Healthcare Ruling?
Sun - Jun 28 - 10:00 – 2-day EU Summit
Thu - Jul 25 - 10:00 – European Central Bank Policy Statement
Charts of Interest: Tuesday and Thursday
This commentary and charts-of-interest are designed to stimulate thinking. This analysis is not a recommendation to buy, sell, hold or sell short any security (stock ETF or otherwise). We all need to think for ourselves when it comes to trading our own accounts. First, it is the only way to really learn. Second, we are the only ones responsible for our decisions. Think of these charts as food for further analysis. Before making a trade, it is important to have a plan. Plan the trade and trade the plan. Among other things, this includes setting a trigger level, a target area and a stop-loss level. It is also important to plan for three possible price movements: advance, decline or sideways. Have a plan for all three scenarios BEFORE making the trade. Consider possible holding times. And finally, look at overall market conditions and sector/industry performance.

About the author:
Arthur Hill, CMT, is the Chief Technical Strategist at TrendInvestorPro.com. Focusing predominantly on US equities and ETFs, his systematic approach of identifying trend, finding signals within the trend, and setting key price levels has made him an esteemed market technician. Arthur has written articles for numerous financial publications including Barrons and Stocks & Commodities Magazine. In addition to his Chartered Market Technician (CMT) designation, he holds an MBA from the Cass Business School at City University in London.
Learn More
