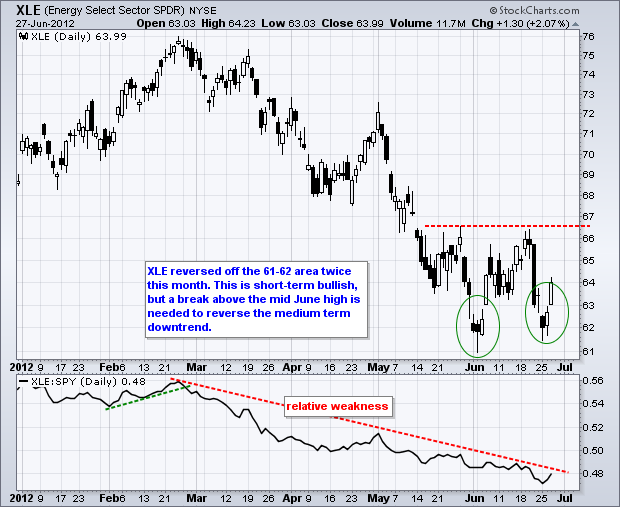
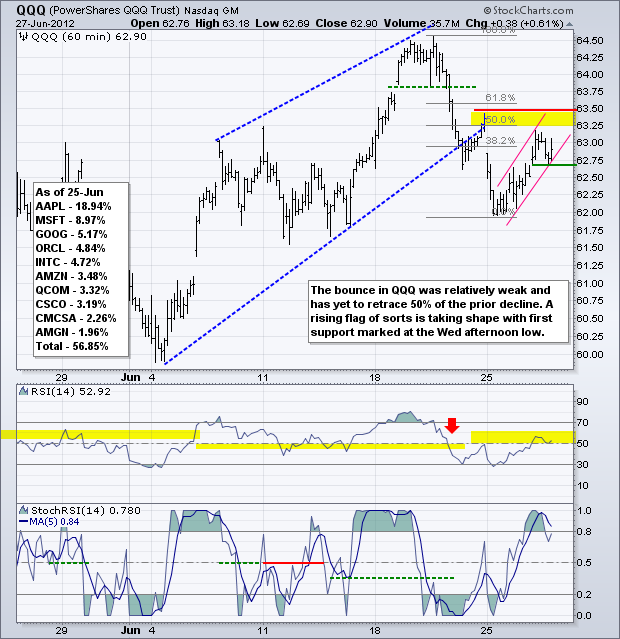
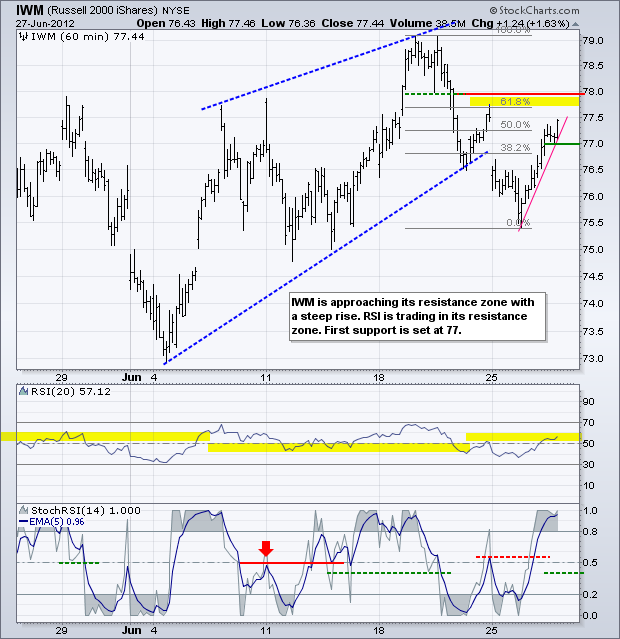
Stocks extended their oversold bounce with modest gains on Wednesday. All major index ETFs were up with the Russell 2000 ETF leading the way (+1.63%). The Dow Industrials SPDR, S&P 500 ETF and Nasdaq 100 ETF were up less than 1%. Eight of the nine sectors were up with the Energy SPDR (XLE) surging over 2%. XLE managed to hold its June low and bounced back to 64. A double bottom could be taking shape, but the trend is down until the pattern is confirmed with a break above the mid June high.
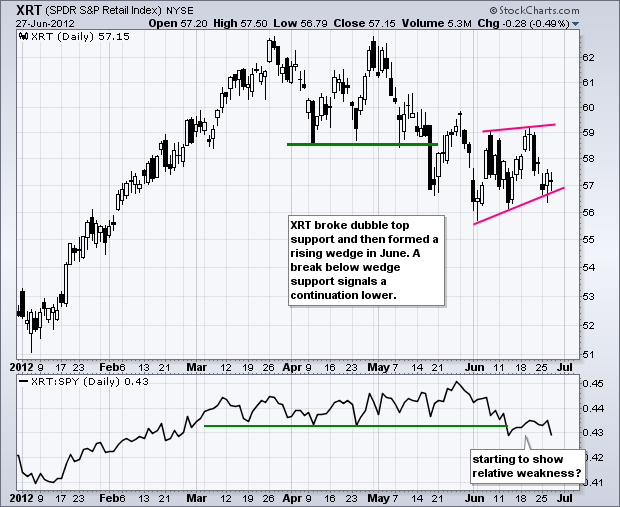
Of note, the Consumer Discretionary SPDR (XLY) edged lower and did not partake in Wednesday's advance. XLY was weighed down by weakness in retailers as the Retail SPDR (XRT) declined half a percent. As noted before, the consumer discretionary sector is the most important sector for predicting economic performance and retailers dominate this sector. A wedge break in XRT would be quite bearish for the sector and the broader market.
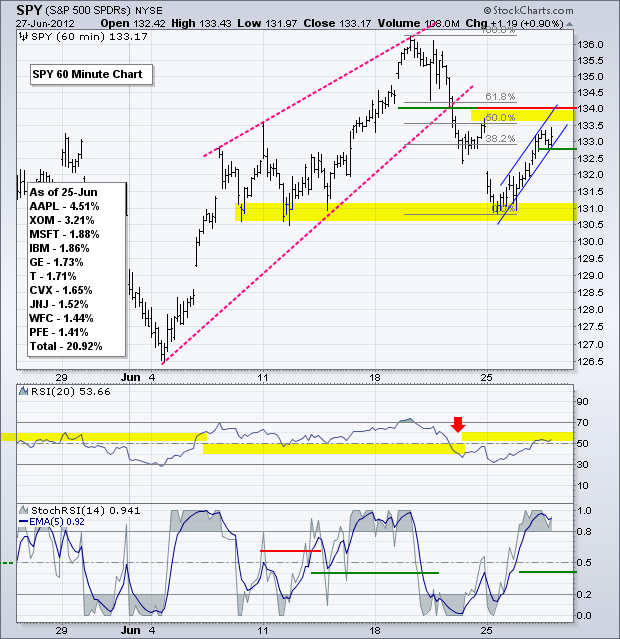
With a bounce off support from the mid June lows, the S&P 500 ETF (SPY) is nearing resistance in the 133.5-134 area. Resistance here stems from the 50-61.80% retracement zone, the wedge trendline break and last Friday's high. Also notice that RSI entered its resistance zone (50-60). Even though the advance is rather steep, it could be a sharp rising flag with the Wednesday afternoon low marking first support. The 5-period EMA of StochRSI is above .80 and overbought. A move back below .40 would signal a downturn in the momentum of momentum (RSI). Keep in mind that the Supreme Court will likely rule on the healthcare law today and this could shake up the markets. I have no idea how the court will rule. As far as market reaction, I suspect that stocks would move lower if the court were to strike down the individual mandate because this would create more uncertainty.
**************************************************************************
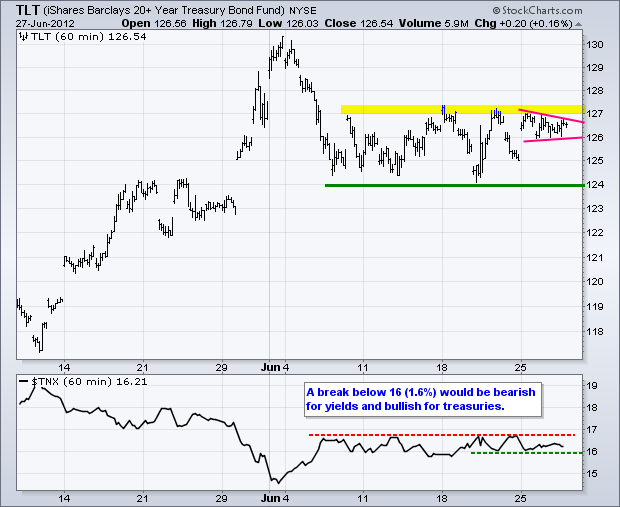
No change. The 20+ Year T-Bond ETF (TLT) is just waiting for the bout of stock market weakness or global uncertainty. TLT traded up to resistance and then consolidated with a pennant type formation. A break above pennant resistance would signal a continuation higher and this could be negative for stocks. Failure to break resistance and a move back to support would be positive. A support break at 124 would be very bullish for stocks, but we have yet to see even a step in that direction.
**************************************************************************
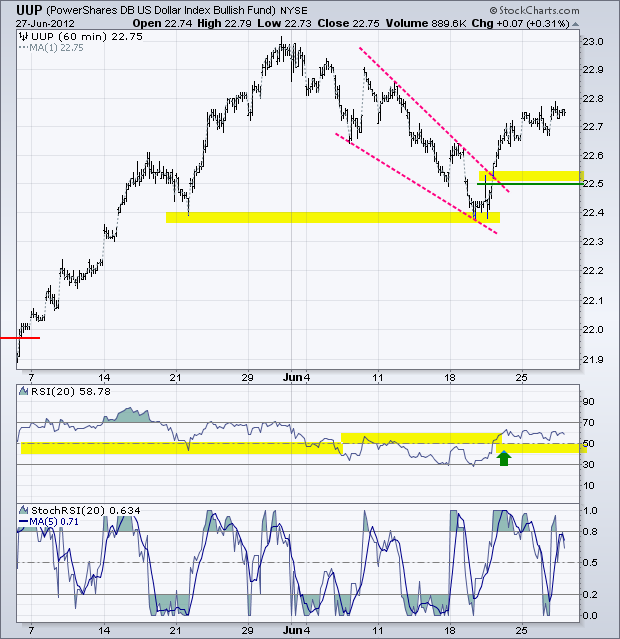
No change. Is anyone bullish on the Euro? Being the short the Euro is definitely a crowded trade, but EU officials are not giving the bears reason to doubt their stance. The EU summit starts tomorrow and expectations are low, but any positives could trigger a short-covering rally. Most likely, we will see more muddling through until Greece's next debt payment, which is due to the European Central Bank (ECB) in August. The US Dollar Fund (UUP) broke resistance and is holding this breakout. Broken resistance turns first support in the 22.50 area.
**************************************************************************
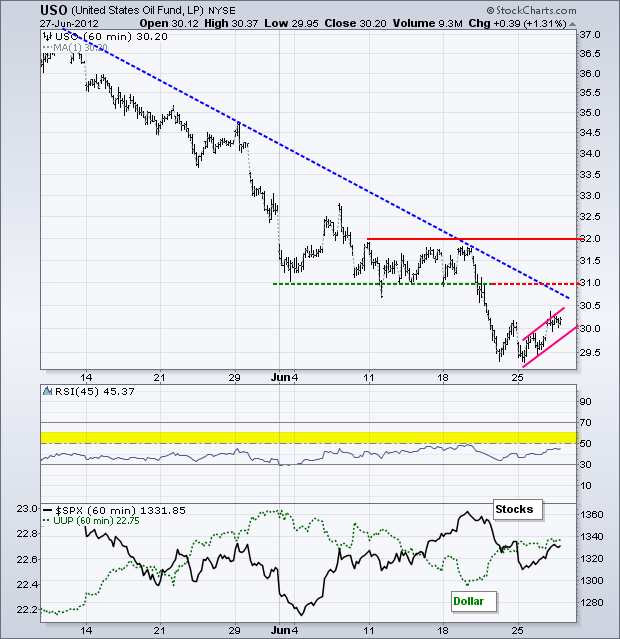
No change. The US Oil Fund (USO) firmed along with the stock market and Euro over the last few days (after Monday's open). These three are joined at the hip and should continue moving together. USO established minor resistance with Friday's high and a break would argue for an oversold bounce towards the June consolidation.
**************************************************************************
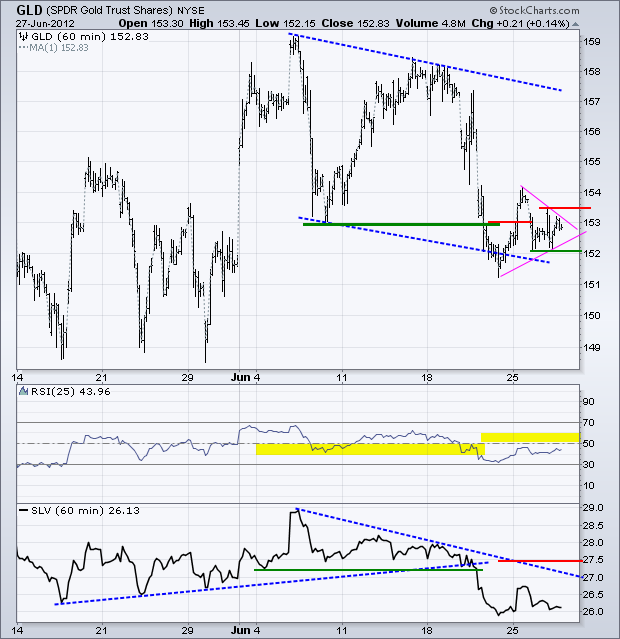
The Gold SPDR (GLD) plunged last week and then formed a consolidation the last four days. A consolidation after a sharp decline is usually bearish. This means a break below 152 would signal a continuation lower and target further weakness towards the 149 area. There are sometimes breaks the other way, but I think selling pressure is dominant right now. Nevertheless, a move above 153.5 would give the bulls some hope.
**************************************************************************
Key Reports and Events:
Thu - Jun 28 - 08:30 – Initial Jobless Claims
Thu - Jun 28 - 08:30 – GDP
Thu - Jun 28 - 08:30 – Supreme Court Healthcare Ruling?
Thu - Jun 28 – 08:30 – 2-day EU Summit Begins
Fri - Jun 29 - 08:30 - Personal Income & Spending
Fri - Jun 29 - 09:45 - Chicago Purchasing Managers Index (PMI)
Fri - Jun 29 - 09:55 - Michigan Sentiment
Fri - Jun 29 - 12:00 – 2-day EU Summit Ends
Thu - Jul 05 - 10:00 – European Central Bank Policy Statement
Charts of Interest: Tuesday and Thursday
This commentary and charts-of-interest are designed to stimulate thinking. This analysis is not a recommendation to buy, sell, hold or sell short any security (stock ETF or otherwise). We all need to think for ourselves when it comes to trading our own accounts. First, it is the only way to really learn. Second, we are the only ones responsible for our decisions. Think of these charts as food for further analysis. Before making a trade, it is important to have a plan. Plan the trade and trade the plan. Among other things, this includes setting a trigger level, a target area and a stop-loss level. It is also important to plan for three possible price movements: advance, decline or sideways. Have a plan for all three scenarios BEFORE making the trade. Consider possible holding times. And finally, look at overall market conditions and sector/industry performance.

