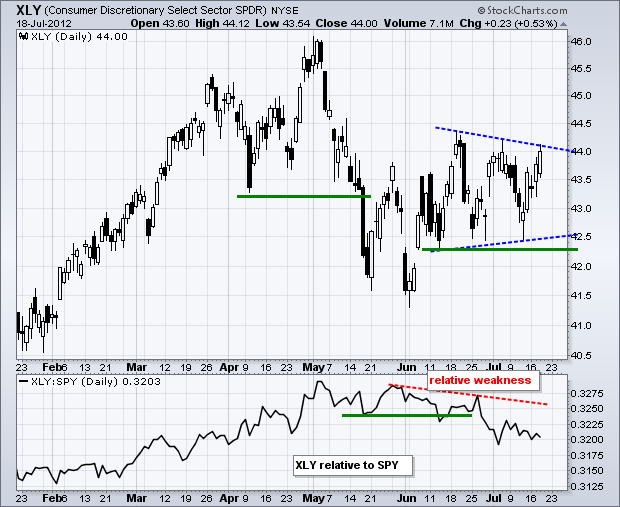
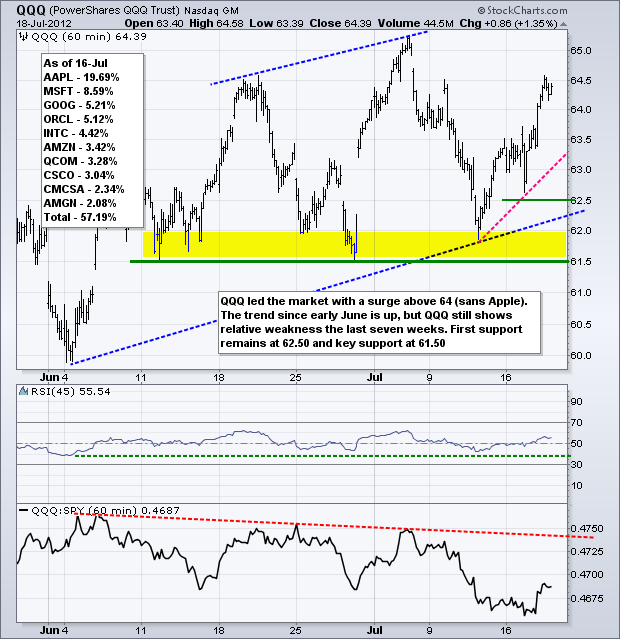
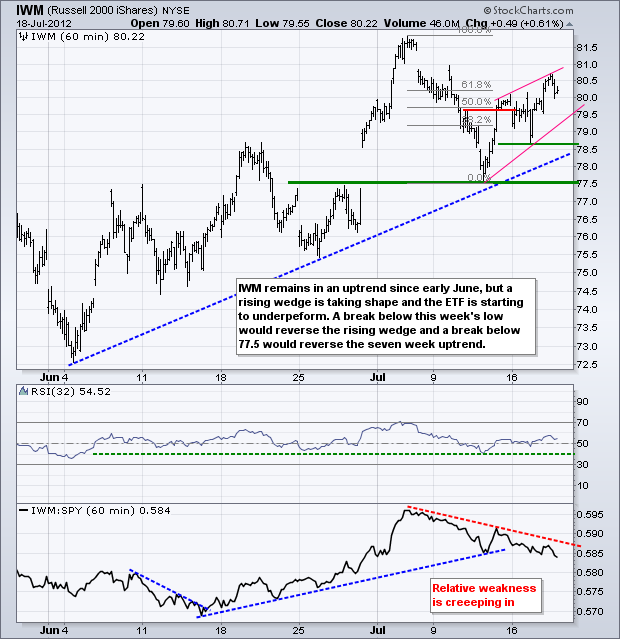
The bulls simply refuse to buckle. Economic reports have been below expectations for months, earnings are less than stellar and the Fed stands ready to act. Perhaps the stock market is pricing in quantitative easing for August or September. Even though stocks advanced, the advance was not even and did not lift all boats. The Finance SPDR (XLF) lagged with a small loss and the Consumer Discretionary SPDR (XLY) was up just 1/2%. Yesterday's strength came from the Technology SPDR (XLK) and the Industrials SPDR (XLI), both of which were up over 1.75%. XLY is challenging its June-July highs in the 44-44.3 area this week and a move above 44.5 would break triangle resistance. This could lead to an assault on the May high. Failure and a break below the mid June lows would be most bearish. Note that XLY still shows relative weakness as the price relative (XLY:SPY ratio) broke down in late June and has yet to recover.
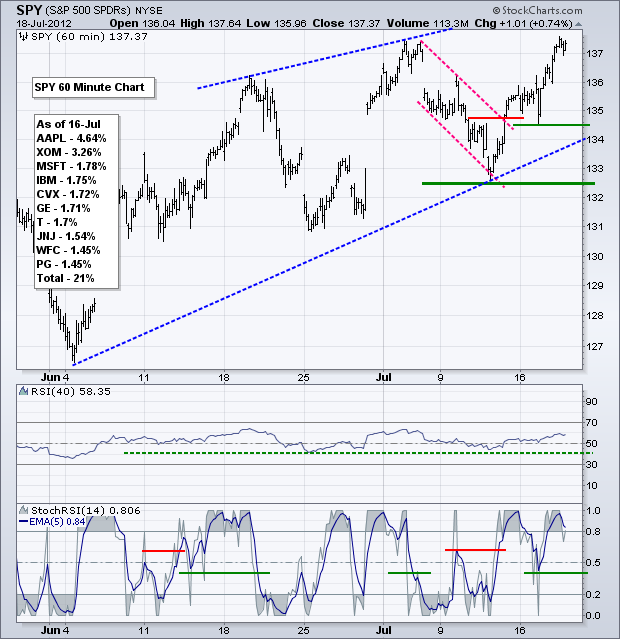
There is no change on the 60-minute chart for the S&P 500 ETF. SPY remains in medium-term and short-term uptrends. SPY broke channel resistance on Friday and extended its gains over the last three days. The ETF is now challenging the early July high. The channel breakout and Tuesday low mark first support. Key support remains at 132.50 and RSI support at 40. The 5-period EMA of StochRSI broke out last week and held .40 this week. This is the first support level to watch for momentum.
**************************************************************************
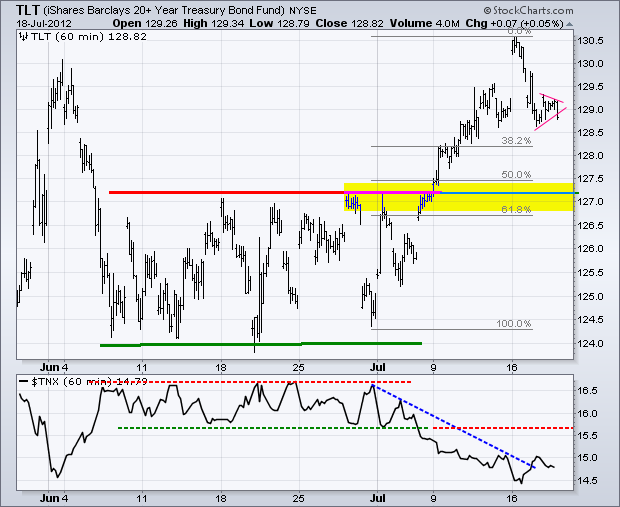
The 20+ Year T-Bond ETF (TLT) fell from 30.5 to 128.8 this week and weakness in treasuries is helping the stock market. These two are like a seesaw. One advances as the other declines and visa versa. TLT remains in an uptrend overall, but appears to be working off recent excesses. A small pennant formed after a sharp decline and the ETF broke pennant support late Wednesday. Broken resistance and the 50-61.80% retracement zone mark next support.
**************************************************************************
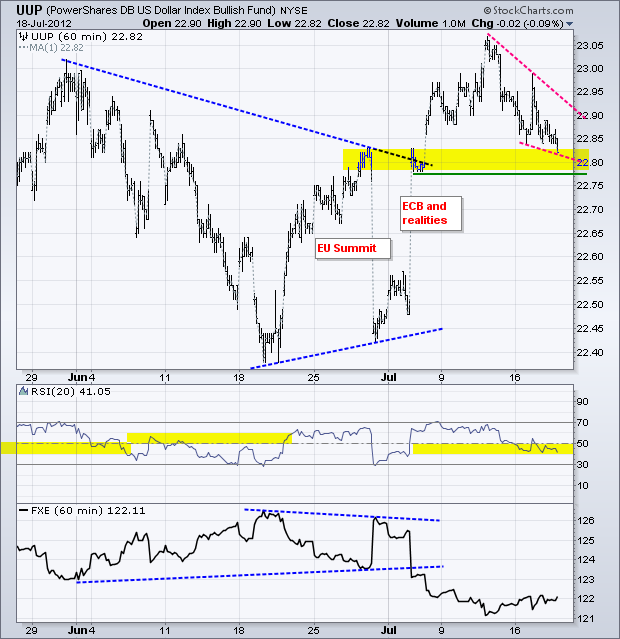
No change. The US Dollar Fund (UUP) extended its retreat with a close below 22.85 on Tuesday. So far, I consider this to be a corrective move within a bigger uptrend. UUP broke resistance with a surge from 22.45 to 23.05 in early July. Some sort of pullback or consolidation can be expected after such a strong move. Broken resistance turns first support in the 22.80 area.
**************************************************************************
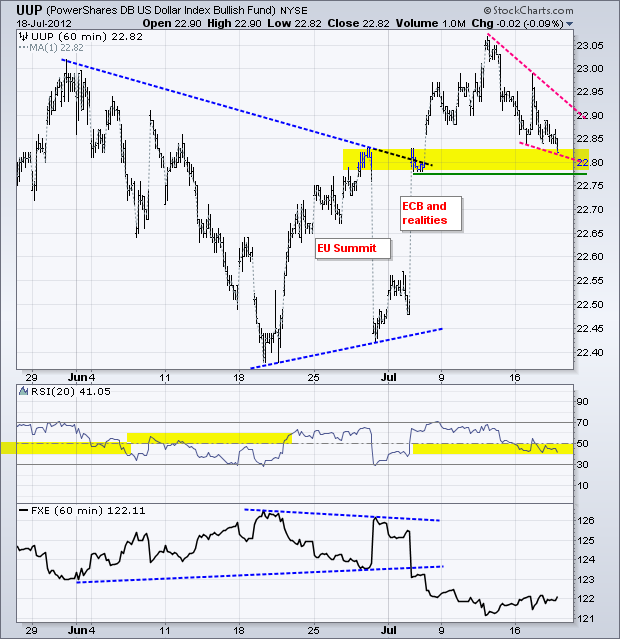
Speaking of seesaws, oil and the Dollar have been riding the seesaw the last few months. First, oil surged when the Dollar plunged in late June. Second, oil corrected when the Dollar rebounded in early July. Third, oil broke falling wedge resistance when the Dollar pulled back the last four days. This breakout held and broken resistance turns first support in the 32.50 area. Key support remains at 31.50 and RSI support at 40.
**************************************************************************
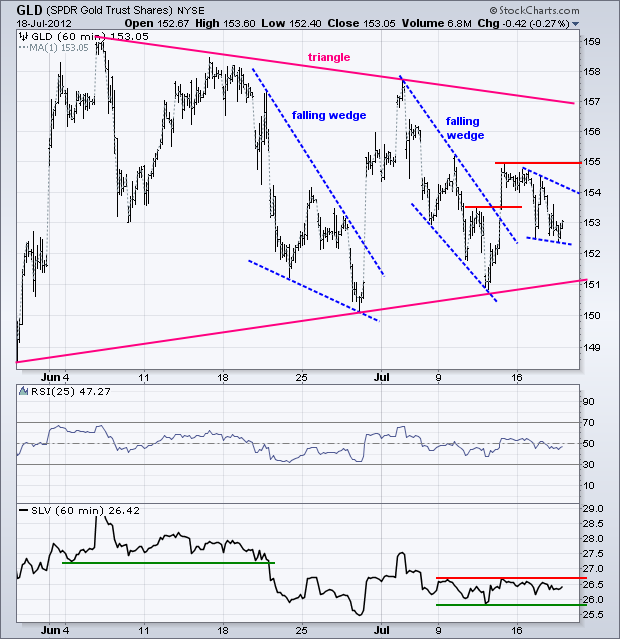
Despite help from a weaker Dollar and stronger stock market, the Gold SPDR (GLD) did not hold its wedge breakout and fell back below 153. Gold should be challenging its July high right now. But it isn't. Instead, GLD is testing support in the low 150s. A break below the late June low would be very bearish for bullion. A smaller falling wedge may be taking shape, but we need a break above 155 to put GLD back on a short-term uptrend.
**************************************************************************
Key Reports and Events:
Thu - Jul 19 - 08:30 - Jobless Claims
Thu - Jul 19 - 10:00 - Existing Home Sales
Thu - Jul 19 - 10:00 - Philadelphia Fed
Thu - Jul 19 - 10:00 - Leading Indicators
Fri - Jul 20 - 08:00 - TGIF
Charts of Interest: Tuesday and Thursday
This commentary and charts-of-interest are designed to stimulate thinking. This analysis is not a recommendation to buy, sell, hold or sell short any security (stock ETF or otherwise). We all need to think for ourselves when it comes to trading our own accounts. First, it is the only way to really learn. Second, we are the only ones responsible for our decisions. Think of these charts as food for further analysis. Before making a trade, it is important to have a plan. Plan the trade and trade the plan. Among other things, this includes setting a trigger level, a target area and a stop-loss level. It is also important to plan for three possible price movements: advance, decline or sideways. Have a plan for all three scenarios BEFORE making the trade. Consider possible holding times. And finally, look at overall market conditions and sector/industry performance.

