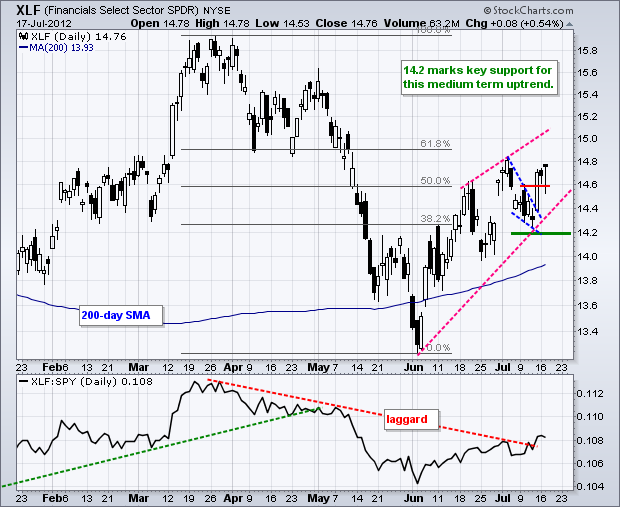
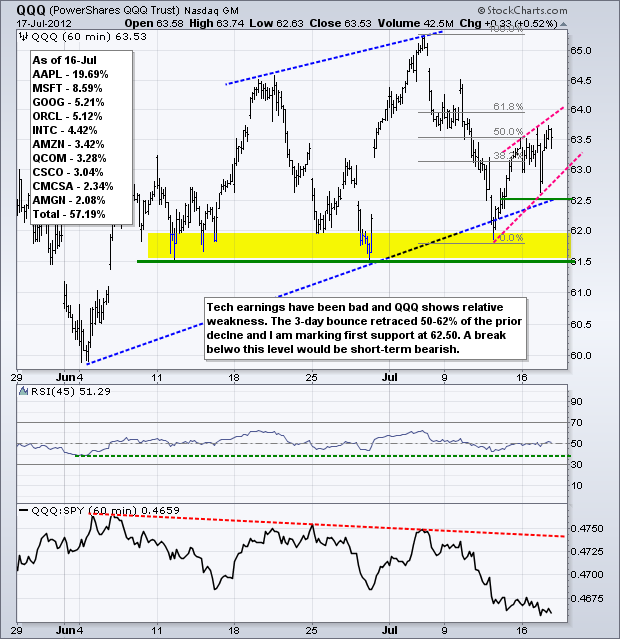
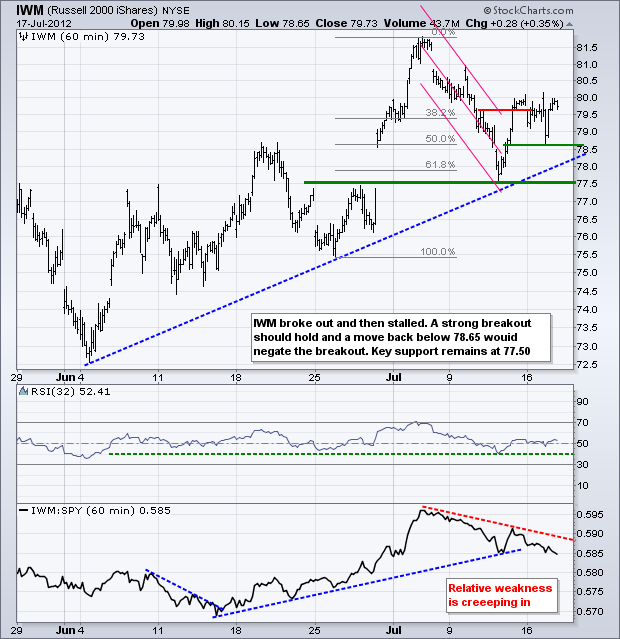
Stocks were edgy on Tuesday as Fed chairman Ben Bernanke testified before congress. After an initial pop on the open, the major index ETFs dipped lower for around 40 minutes and then surged back into positive territory in the early afternoon. Tuesday's dip now provides a short-term support level to watch going forward. We could see more volatility as Bernanke continues his testimony on Wednesday. Mr. market could even pick a definitive medium-term direction once his testimony ends. Focus will turn back to earnings once testimony ends and earnings reports have been less than stellar so far.
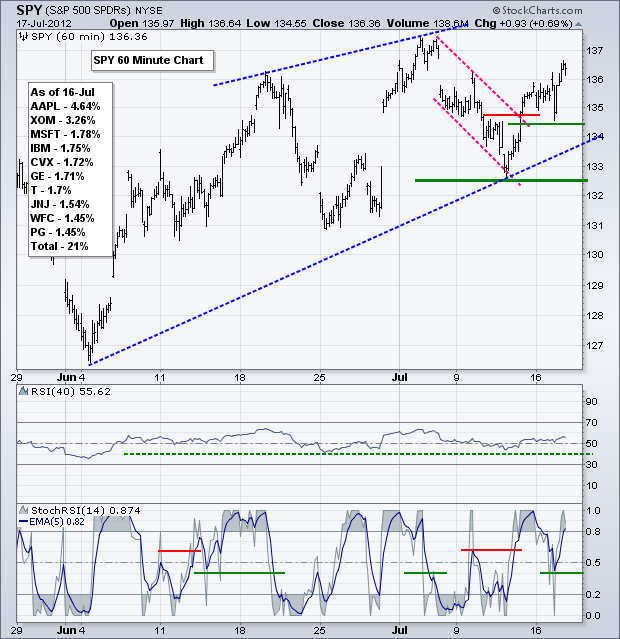
The S&P 500 ETF (SPY) remains in medium-term and short-term uptrends, but an interesting setup is emerging on the 60-minute chart. First, SPY broke channel resistance and this breakout is holding. The ETF dipped below 135 in early trading, but recovered to affirm this support level. A break below 134.5 would negate the channel breakout and provide the first bearish signal. Key support remains at 132.5 and it would take a break below this level to reverse the 6-7 week uptrend. The 5-period EMA of StochRSI established support at .40 with a bounce above .80 on Tuesday. A break below .40 would trigger the first bearish signal for momentum. Keep in mind that StochRSI is a hyperactive momentum oscillator for the very short-term.
**************************************************************************
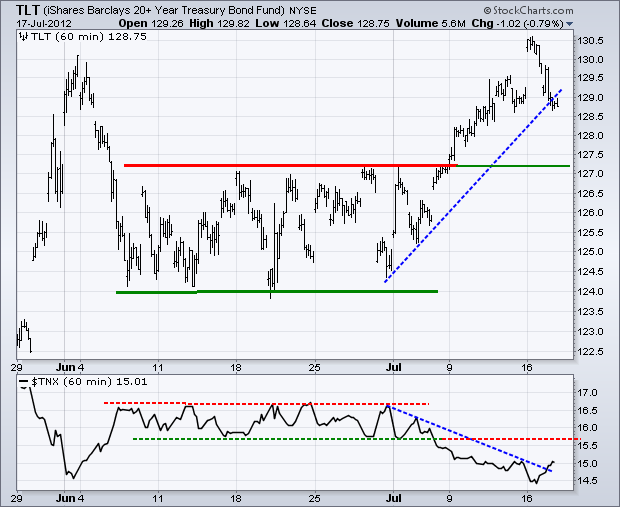
The 20+ Year T-Bond ETF (TLT) surged above 130 on Monday morning and then fell back below 129 by Tuesday's close. Despite this decline, the bigger trend remains up and the breakout at 127 is holding. After a run from 124.5 to 130.5, some sort of pullback or consolidation can be expected. Only a move back below 127 would suggest enough weakness to warrant a reassessment of the overall uptrend.
**************************************************************************
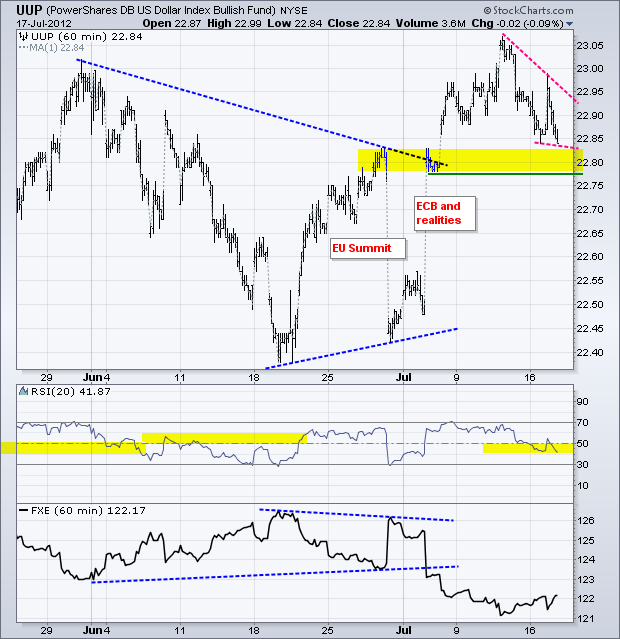
The US Dollar Fund (UUP) extended its retreat with a close below 22.85 on Tuesday. So far, I consider this to be a corrective move within a bigger uptrend. UUP broke resistance with a surge from 22.45 to 23.05 in early July. Some sort of pullback or consolidation can be expected after such a strong move. Broken resistance turns first support in the 22.80 area.
**************************************************************************
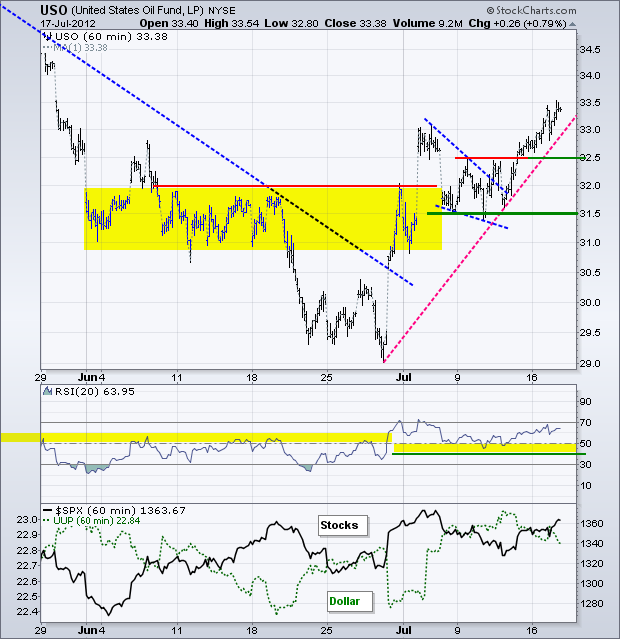
No change. Commodities will also be listening intently for signs of quantitative easing, which would be bullish for oil et al. The US Oil Fund (USO) broke falling wedge resistance and this breakout is holding. Key support is set at 31.50 on the price chart and momentum support is set at 40 (RSI).
**************************************************************************
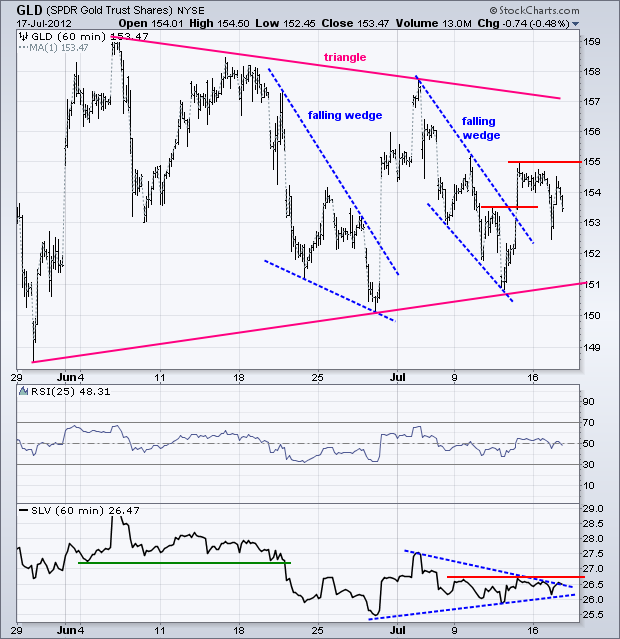
The Gold SPDR (GLD) turned volatile as the Dollar swung wildly and treasuries moved lower. GLD dipped below 153, but recovered with a surge back above 154 – only to finish weak with an afternoon dip. This falling wedge breakout is looking vulnerable to a failure and I am marking short-term resistance at 155. Keep in mind that gold has been trending lower since August and the bigger triangle looks like a consolidation within a downtrend.
**************************************************************************
Key Reports and Events:
Wed - Jul 18 - 07:00 - MBA Mortgage Index
Wed - Jul 18 - 08:30 - Housing Starts/Building Permits
Wed - Jul 18 - 10:30 - Oil Inventories
Wed - Jul 18 - 14:00 - Fed's Beige Book
Thu - Jul 19 - 08:30 - Jobless Claims
Thu - Jul 19 - 10:00 - Existing Home Sales
Thu - Jul 19 - 10:00 - Philadelphia Fed
Thu - Jul 19 - 10:00 - Leading Indicators
Charts of Interest: Tuesday and Thursday
This commentary and charts-of-interest are designed to stimulate thinking. This analysis is not a recommendation to buy, sell, hold or sell short any security (stock ETF or otherwise). We all need to think for ourselves when it comes to trading our own accounts. First, it is the only way to really learn. Second, we are the only ones responsible for our decisions. Think of these charts as food for further analysis. Before making a trade, it is important to have a plan. Plan the trade and trade the plan. Among other things, this includes setting a trigger level, a target area and a stop-loss level. It is also important to plan for three possible price movements: advance, decline or sideways. Have a plan for all three scenarios BEFORE making the trade. Consider possible holding times. And finally, look at overall market conditions and sector/industry performance.

About the author:
Arthur Hill, CMT, is the Chief Technical Strategist at TrendInvestorPro.com. Focusing predominantly on US equities and ETFs, his systematic approach of identifying trend, finding signals within the trend, and setting key price levels has made him an esteemed market technician. Arthur has written articles for numerous financial publications including Barrons and Stocks & Commodities Magazine. In addition to his Chartered Market Technician (CMT) designation, he holds an MBA from the Cass Business School at City University in London.
Learn More
