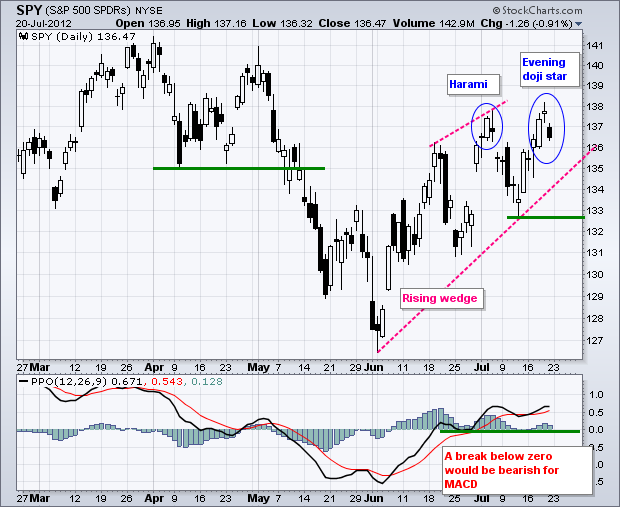
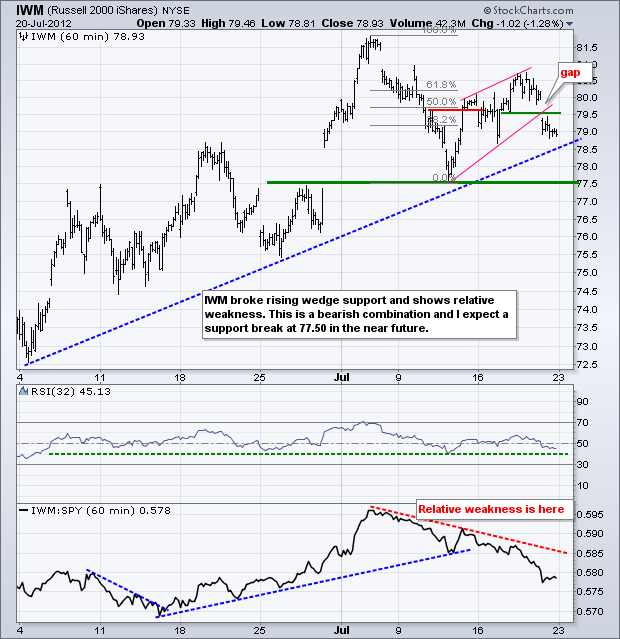
Stocks moved sharply lower on Friday with the Russell 2000 ETF (IWM) and the Nasdaq 100 ETF (QQQ) leading the major index ETFs down. Seven of the nine sectors were lower with the Finance SPDR (XLF) leading this group. The Energy SPDR (XLE) and the Utilities SPDR (XLU) managed to eek out some gains. Overall, the major index ETFs remain in uptrends since early June, but rising wedges are taking shape and an evening doji star formed in the S&P 500 ETF (SPY). Granted, the black candlestick could be longer, but I think the three day reversal captures the spirit of the pattern. There was a long white candlestick, a doji and then a gap down with a black candlestick. This looks like a three day reversal to me. A move above 138 would negate this pattern.
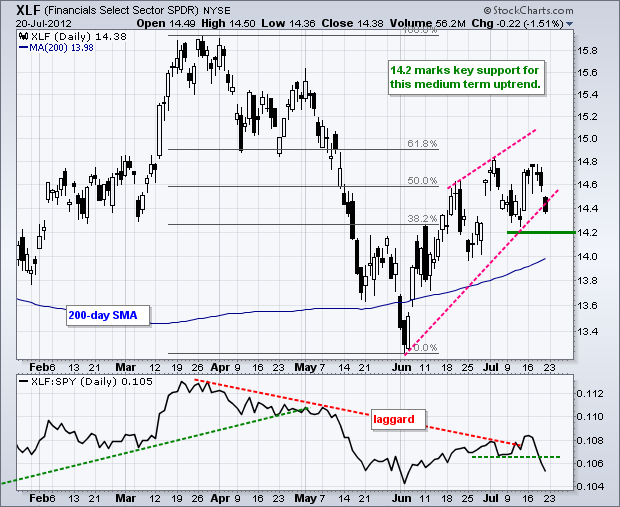
Spain came back to the forefront last week and Greece is returning to center stage this week. Spanish stocks were hit hard on Friday after an auction for Spanish debt was worse-than-expected. The yield on the Spanish 10-year has been above 7% lately and there is now talk of 8%, which would require a sovereign bailout. Greece is back in the news as the troika arrives in Athens today for debt/austerity talks. Germany is taking a tough stance and the IMF is threatening to stop aid payments. Politicians always push these things to the last minute, but the situation in the EU is clearly not improving. This threatens the finance sector because US banks have ties to the big EU banks. XLF started showing relative weakness last week as the price relative (XLF:SPY ratio) broke below its early July low. XLF stalled for three days and then moved lower on Thursday-Friday.
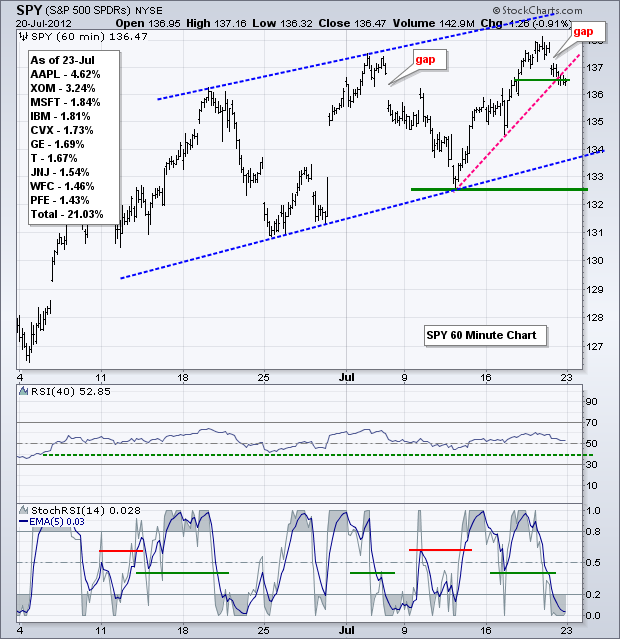
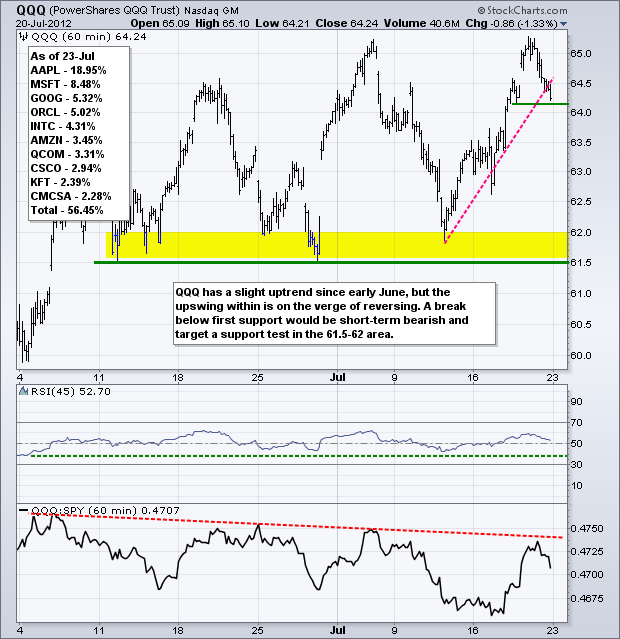
On the 60-minute chart, SPY is now in a short-term downtrend and a medium-term uptrend. The medium-term uptrend remains because SPY has a series of rising peaks and rising troughs since early June. The rising channel trend lines mark these. RSI remains bullish because it is above 50 and key support is marked at 40. The short-term trend is down as SPY gapped down and broke first support at 136.50 on Friday. Also notice that the 5-period EMA of StochRSI broke below support at .40 to confirm. Support in the 132.5-134 area is the first target zone for this short-term downtrend.
**************************************************************************
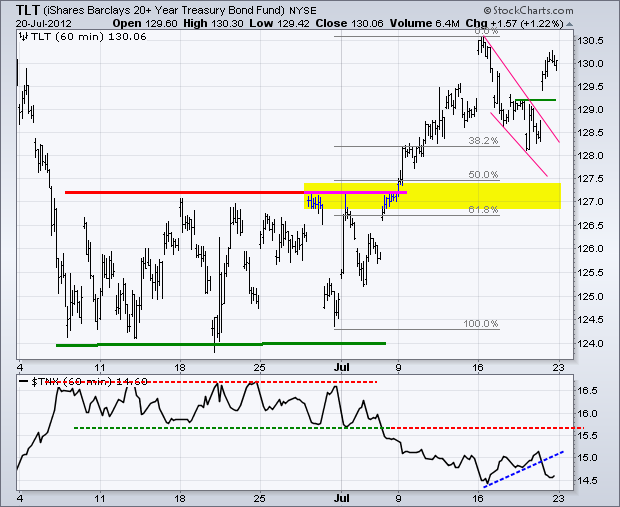
The 20+ Year T-Bond ETF (TLT) reversed near the 38.2% retracement line and broke above falling wedge/flag resistance with a surge back above 130. This move is bullish for bonds and bearish for stocks because it signals a return to risk aversion.
**************************************************************************
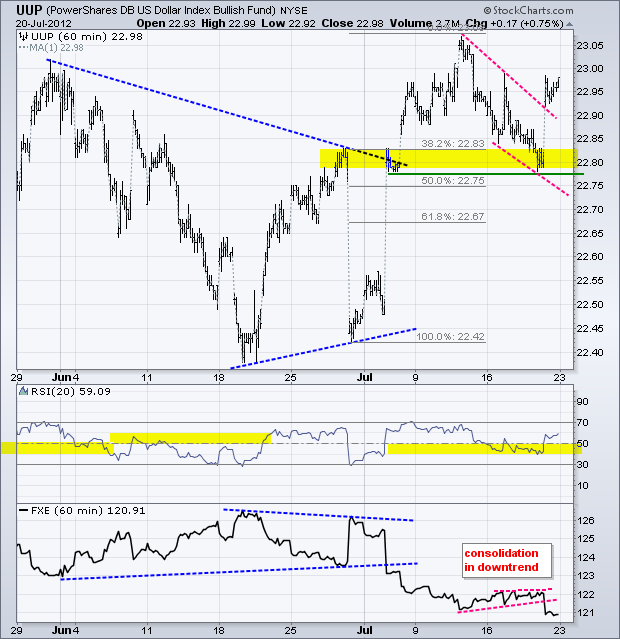
The US Dollar Fund (UUP) followed treasuries higher with a break above wedge resistance to affirm risk aversion. Broken resistance and the 50% retracement turned into support and held. RSI also held support at 40. A breakout in the Dollar is negative for stocks.
**************************************************************************
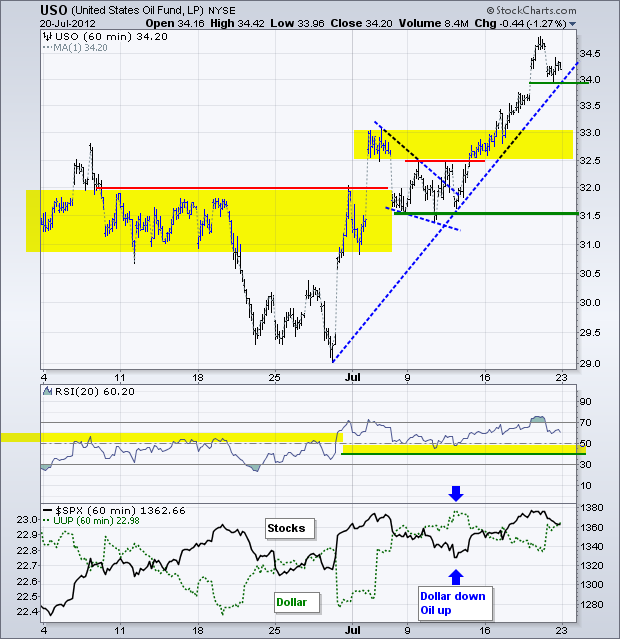
Strength in the Dollar and weakness in the stock market could weigh on oil. Syria and Iran remain the wild cards. Assad is loosing his grip on the capital and will likely fall in the coming weeks. This could destabilize the region and affect oil prices. It is a tough call with this wild card out there, but I think the stock market and Dollar pull more weight. The US Oil Fund (USO) is overbought and I am marking short-term support at 34. A break below this level would argue for a correction back towards broken resistance in the 32.52-33 area.
**************************************************************************
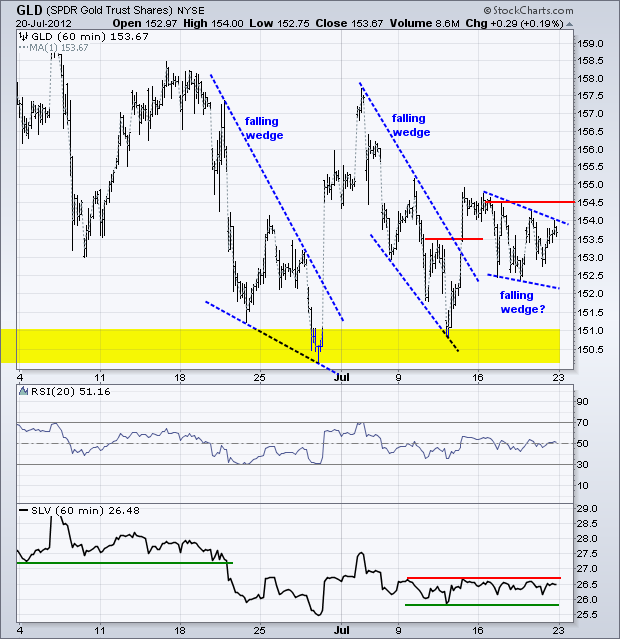
Gold remains part of the risk off trade. This means a stronger Dollar and weaker stock market are negative for bullion. Moreover, gold peaked in August 2010 and remains in a long-term downtrend. The Gold SPDR (GLD) attempted to break falling wedge resistance, but failed to hold this breakout and is likely to test support in the 150.5-151 area soon. A smaller falling flag/wedge may be taking shape, but this needs to be confirmed with a breakout at 154.50.
**************************************************************************
Key Reports and Events:
Tue - Jul 24 - 10:00 - FHFA Housing Price Index
Wed - Jul 25 - 07:00 - MBA Mortgage Index
Wed - Jul 25 - 10:00 - New Home Sales
Wed - Jul 25 - 10:30 - Oil Inventories
Thu - Jul 26 - 08:30 - Jobless Claims
Thu - Jul 26 - 08:30 - Durable Good Orders
Thu - Jul 26 - 10:00 - Pending Home Sales
Fri - Jul 27 - 08:30 - GDP
Fri - Jul 27 - 09:55 - Michigan Sentiment
Charts of Interest: Tuesday and Thursday
This commentary and charts-of-interest are designed to stimulate thinking. This analysis is not a recommendation to buy, sell, hold or sell short any security (stock ETF or otherwise). We all need to think for ourselves when it comes to trading our own accounts. First, it is the only way to really learn. Second, we are the only ones responsible for our decisions. Think of these charts as food for further analysis. Before making a trade, it is important to have a plan. Plan the trade and trade the plan. Among other things, this includes setting a trigger level, a target area and a stop-loss level. It is also important to plan for three possible price movements: advance, decline or sideways. Have a plan for all three scenarios BEFORE making the trade. Consider possible holding times. And finally, look at overall market conditions and sector/industry performance.

