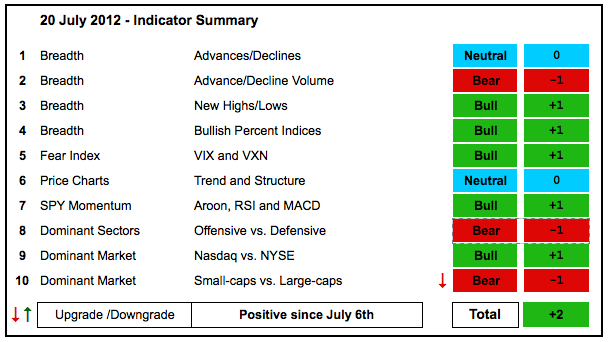
The indicator summary remains positive overall, but I downgraded the small-cap/large-cap indicator because small-caps are seriously underperforming the last two weeks. Even though the indicators remain net positive, I remain concerned because some key indicators are still bearish. The AD Volume Lines are bearish overall and the offensive sectors are not showing leadership. I used to list "intermarket" as one of the indicator groups. If this were still there, I would show it as bearish because treasuries and the Dollar are in uptrends. Stocks are in uptrends since early June, but rising wedges are forming in many key ETFs and these could turn out to be corrective patterns in bigger downtrends.
- AD Lines: Neutral. The Nasdaq AD Line is in a medium-term downtrend since March, but a short-term uptrend since early June. The NYSE AD Line surged to a new high again this week.
- AD Volume Lines: Bearish. The NYSE and Nasdaq AD Volume Lines broke down in May, returned to their support breaks in early July and then turned sharply lower last week. It looks like the smaller uptrend since early June reversed.
- Net New Highs: Bullish. NYSE Net New Highs remain strong as the cumulative line hit a new high this week. Nasdaq Net New Highs are largely positive and the cumulative line remains above its 10-day EMA.
- Bullish Percent Indices: Bullish. Eight of the nine BPIs are above 50%. The Consumer Discretionary Bullish% Index ($BPDISC) hit 58%. Only the Technology Bullish% Index ($BPINFO) is below 50%.
- VIX/VXN: Bullish. The Nasdaq 100 Volatility Index ($VXN) moved below 18% this week and the CBOE Volatility Index ($VIX) broke below 16%. Volatility is low and falling, and this is bullish for stocks.
- Trend-Structure: Neutral. The major index ETFs broke down in May and advanced in June-July. Many price charts show rising wedge patterns over the last seven weeks. These are bearish setups and a break below the late June low would signal a continuation lower.
- SPY Momentum: Bullish. MACD(5,35,5) and Aroon remain in positive territory. RSI broke above 60 again this week and is bullish overall.
- Offensive Sector Performance: Bearish. The consumer discretionary, finance, industrials and technology sectors are underperforming the S&P 500 on the one and three month timeframes.
- Nasdaq Performance: Bullish. The $COMPQ:$NYA ratio remains above its June lows and has yet to break down.
- Small-cap Performance: Bearish. The $RUT:$OEX ratio pulled sharply the last two weeks as small-caps started to seriously underperform large-caps.
- Breadth Charts (here) and Inter-market charts (here) have been updated.
This table is designed to offer an objective look at current market conditions. It does not aim to pick tops or bottoms. Instead, it seeks to identify noticeable shifts in buying and selling pressure. With 10 indicator groups, the medium-term evidence is unlikely to change drastically overnight.
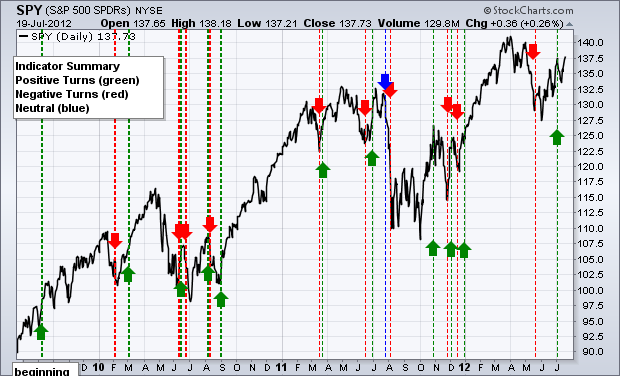
Previous turns include:
Positive on 6-July-12
Negative on 18-May-12
Positive on 30-December-11
Negative on 16-December-11
Positive on 3-December-11
Negative on 23-November-11
Positive on 28-October-11
Negative on 5-August-11
Neutral on 29-Jul-11
Positive on 30-Jun-11
Negative on 17-Jun-11
Positive on 25-Mar-11
Negative on 18-Mar-11
Positive on 3-Sep-10
Negative on 13-Aug-10
Positive on 6-Aug-10
Negative on 24-Jun-10
Positive on 18-Jun-10
Negative on 11-Jun-10
Positive on 5-March-10
Negative on 5-Feb-10
Positive on 11-Sept-09


