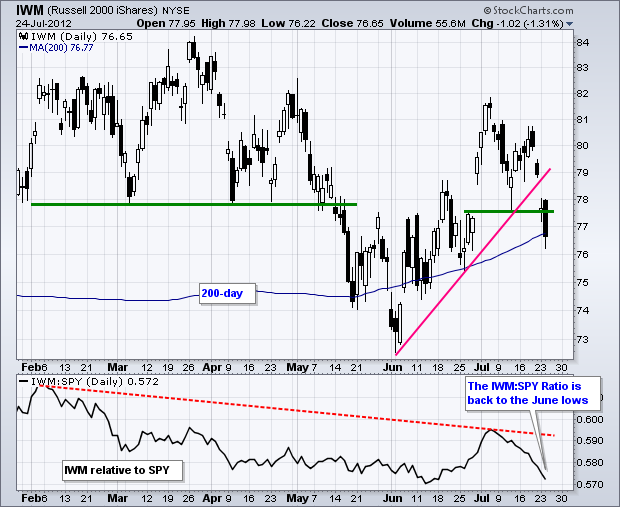
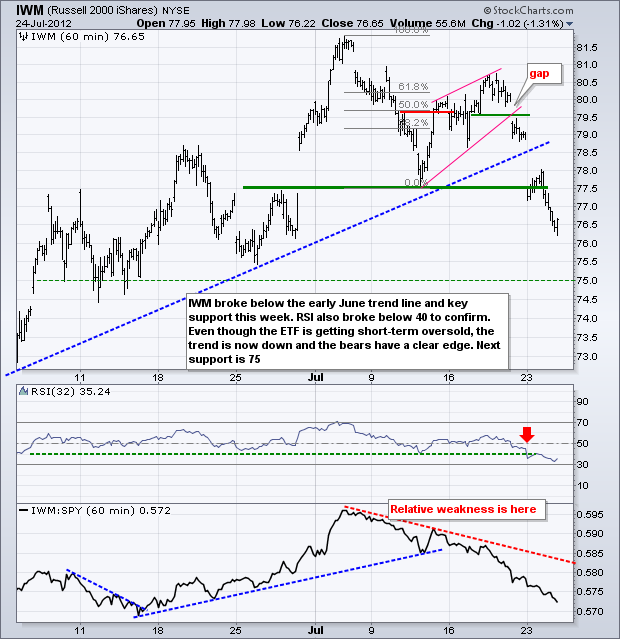
Stocks were under selling pressure again on Tuesday with the Russell 2000 ETF (IWM) and S&P MidCap 400 SPDR (MDY) leading the way lower. Small and mid-caps are less diversified than large-caps and they have less overseas exposure. In other words, they are more domestically oriented. Relative weakness in small-caps and mid-caps is a negative sign for the stock market overall and the economy. The chart below shows IWM breaking support with a long black candlestick and testing its 200-day moving average. The price relative (IWM:SPY ratio) fell back to its June low at IWM showed relative weakness in July.
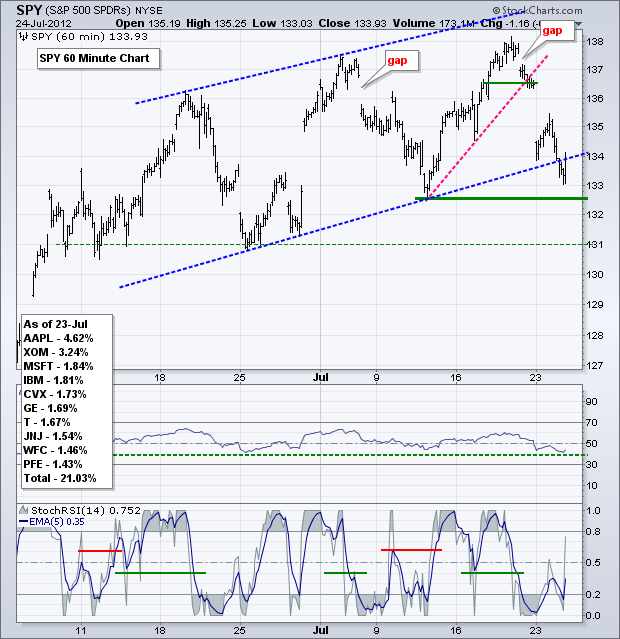
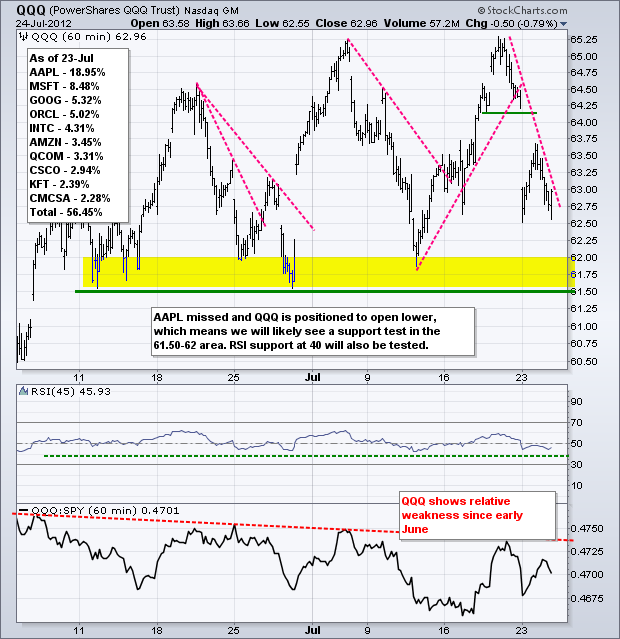
On the 60-minute chart, SPY continued lower on Tuesday and then got a late bounce near the early July low. Perhaps it was short covering ahead of Apple earnings, which missed the mark. Regardless, SPY broke the channel trend line and is on the verge of breaking key support at 132.50. Notice that RSI is also testing support at 40 and a break below this level would turn momentum bearish. While a support break at 132.5 would fully reverse the eight week uptrend, SPY would become short-term oversold on such a break and there may be some sort of support in the 131 area.
**************************************************************************
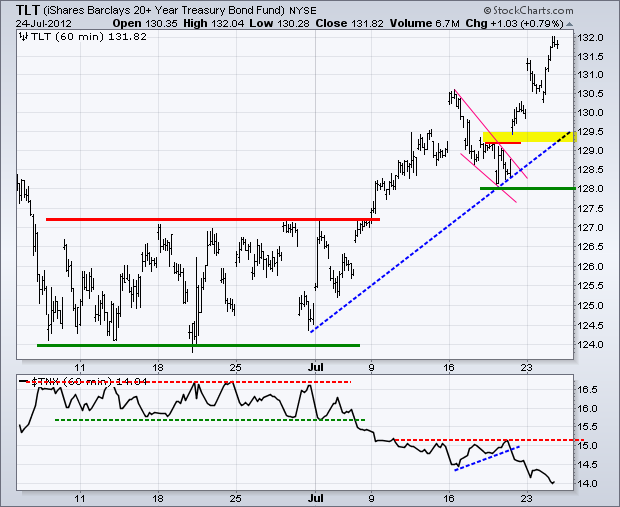
The 20+ Year T-Bond ETF (TLT) took off on Friday and continued higher Monday-Tuesday as money moved into relative safety. The 10-year Treasury Yield ($TNX) dipped below 1.4% during the day as yields plunged. There may be no return, but there are certainly capital gains to be had as TLT advanced some 6% since late June. Broken resistance turns first support around 129.5 and key support remains at 128.
**************************************************************************
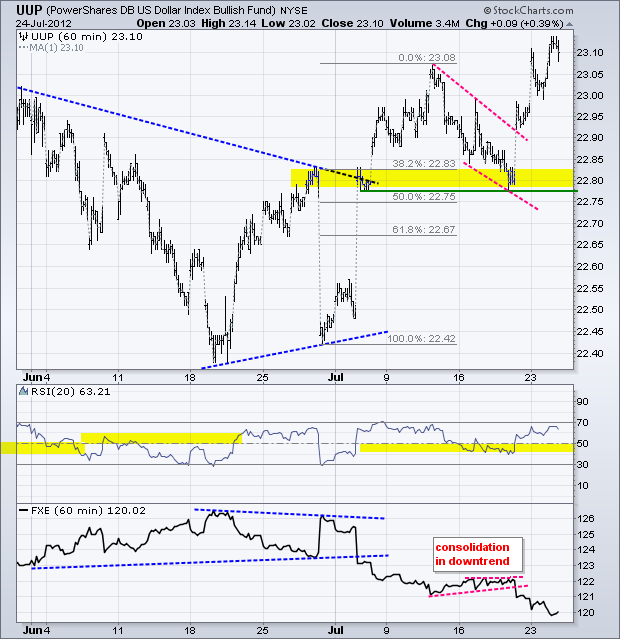
The US Dollar Fund (UUP) followed treasuries higher the last three days. All trends are up for the Dollar: short-term, medium-term and long-term. After the falling flag breakout, the mid July low marks key support. RSI support is set at 40.
**************************************************************************
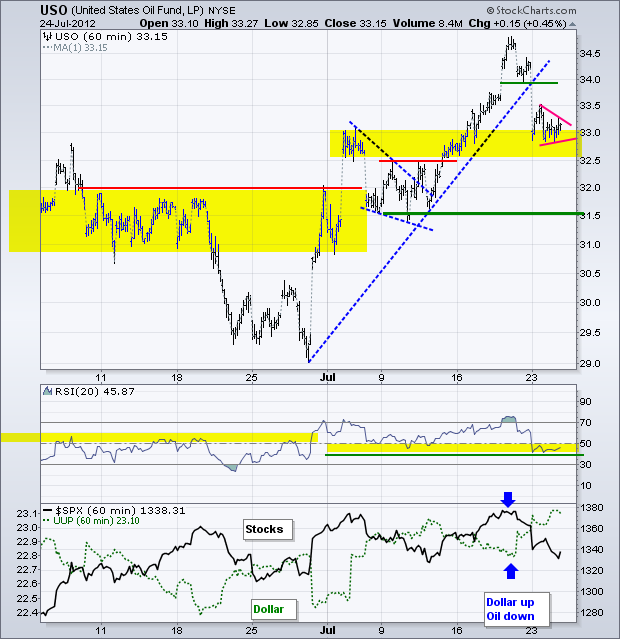
The US Oil Fund (USO) held up pretty good considering the circumstances: a weak stock market and strong Dollar. It looks like Middle East issues are keeping a bid alive, but I am now sure how long this bid will last though. Weakening stock markets suggest weakening economies and this will put a damper on demand for oil. USO moved sharply lower on Monday and then consolidated in the 33 area. A break below consolidation support would signal a continuation lower and target a move back to the 31.5-32 area. RSI is testing support at 40.
**************************************************************************
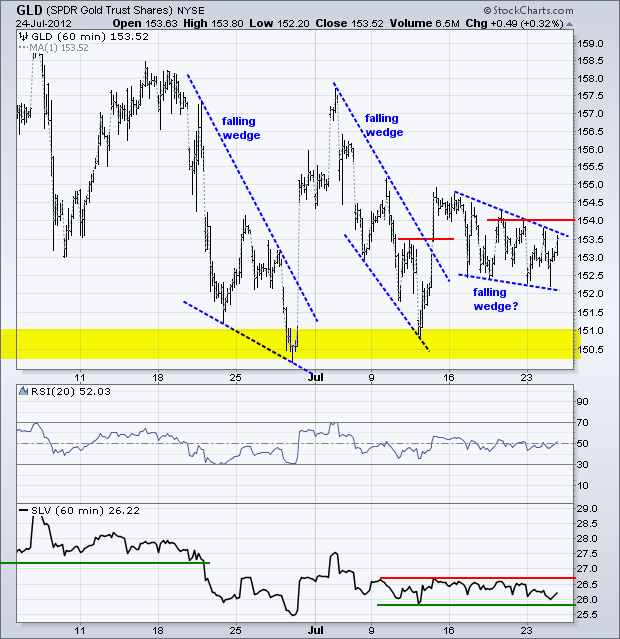
Gold is holding up rather well considering the circumstances. Perhaps Euro money is finding its way into bullion. While the long-term and short-term trends are down, the Gold SPDR (GLD) has a potentially bullish pattern forming the last 8 days. After surging above 153.5 in mid July, the ETF consolidated with a falling wedge. A move above 154 would break falling wedge resistance and signal a continuation of the mid July surge.
**************************************************************************
Key Reports and Events:
Wed - Jul 25 - 07:00 - MBA Mortgage Index
Wed - Jul 25 - 10:00 - New Home Sales
Wed - Jul 25 - 10:30 - Oil Inventories
Thu - Jul 26 - 08:30 - Jobless Claims
Thu - Jul 26 - 08:30 - Durable Good Orders
Thu - Jul 26 - 10:00 - Pending Home Sales
Fri - Jul 27 - 08:30 - GDP
Fri - Jul 27 - 09:55 - Michigan Sentiment
Charts of Interest: Tuesday and Thursday
This commentary and charts-of-interest are designed to stimulate thinking. This analysis is not a recommendation to buy, sell, hold or sell short any security (stock ETF or otherwise). We all need to think for ourselves when it comes to trading our own accounts. First, it is the only way to really learn. Second, we are the only ones responsible for our decisions. Think of these charts as food for further analysis. Before making a trade, it is important to have a plan. Plan the trade and trade the plan. Among other things, this includes setting a trigger level, a target area and a stop-loss level. It is also important to plan for three possible price movements: advance, decline or sideways. Have a plan for all three scenarios BEFORE making the trade. Consider possible holding times. And finally, look at overall market conditions and sector/industry performance.

About the author:
Arthur Hill, CMT, is the Chief Technical Strategist at TrendInvestorPro.com. Focusing predominantly on US equities and ETFs, his systematic approach of identifying trend, finding signals within the trend, and setting key price levels has made him an esteemed market technician. Arthur has written articles for numerous financial publications including Barrons and Stocks & Commodities Magazine. In addition to his Chartered Market Technician (CMT) designation, he holds an MBA from the Cass Business School at City University in London.
Learn More
