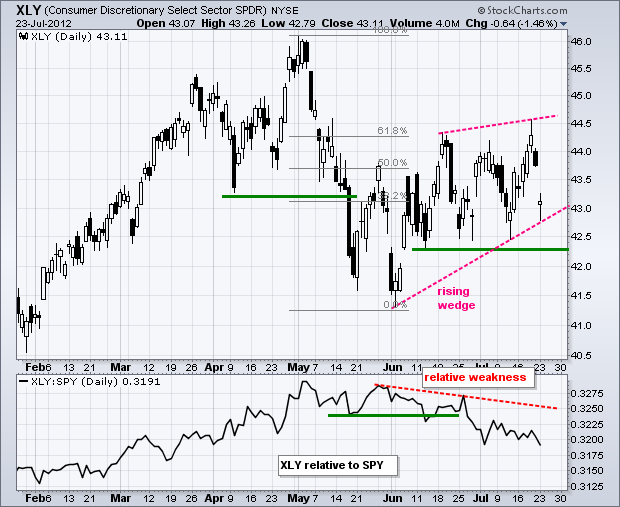
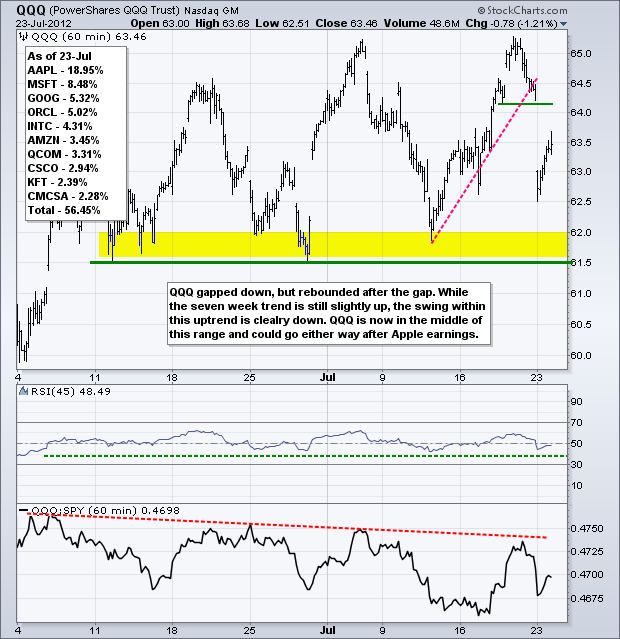
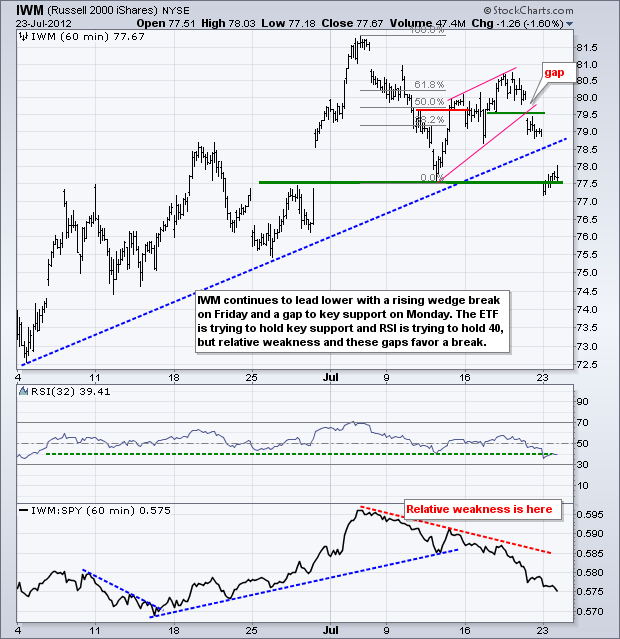
The major index ETFs were hit with strong selling pressure on the open, but managed to bounce after gapping down. Nevertheless, the major index ETFs finished with losses and the gaps held. Small-caps led the way lower as the Russell 2000 ETF (IWM) lost 1.60%. All nine sectors were down with the Consumer Discretionary SPDR (XLY) and Basic Materials SPDR (XLB) leading. Relative weakness in the consumer discretionary sector suggests underlying weakness in the US economy. Relative weakness in materials sector reflects the decline in Asian stocks. On the XLY chart below, the ETF failed at the 61.80% retracement and gapped down to the lower trend line of the rising wedge. There is a lot of support in the 42.50 area and a break below the mid June lows would be signal a continuation of the May decline. I expect a break because XLY shows relative weakness as the price relative (XLY:SPY ratio) has been trending down since early May.
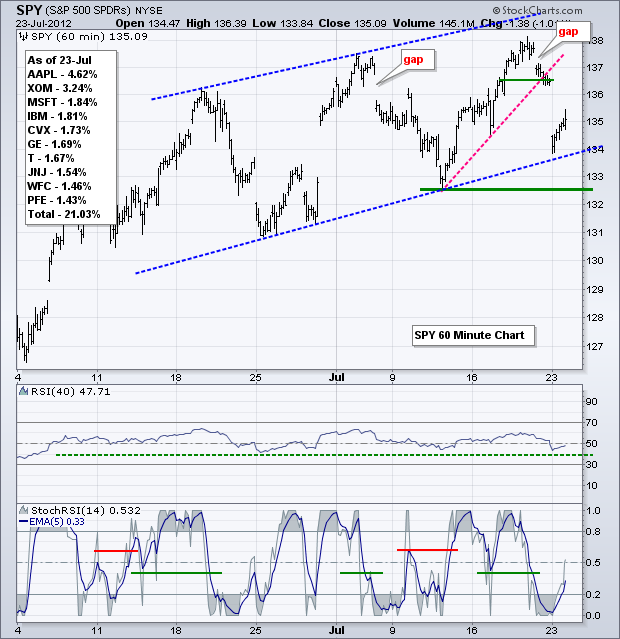
On the 60-minute chart, SPY plunged towards the lower trend line of the rising channel. The ETF bounced after the open, but the bounce came nowhere close to filling the gap. Technically, the bigger trend since early June is up as the ETF zigzags higher. The swing within this uptrend is down after the last two gaps down. A big test now looms as the ETF tests support from the trend line. A trend line break and move below the early July low would clearly reverse this bigger uptrend. RSI moved into the 40-50 zone and this zone also marks a test for the seven week uptrend.
**************************************************************************
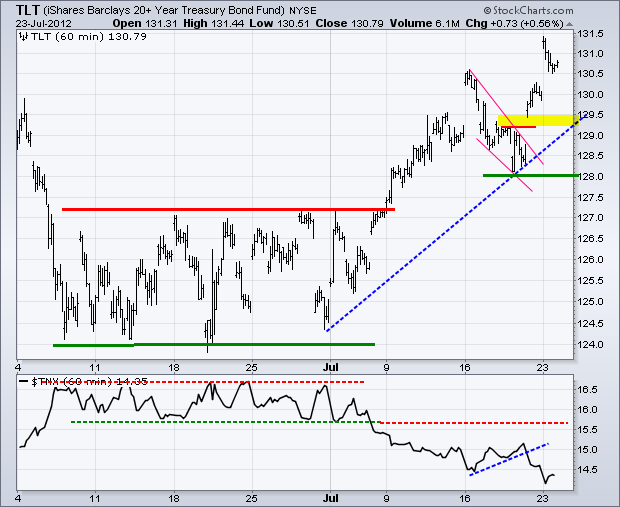
The 20+ Year T-Bond ETF (TLT) surged higher the last two days as money moved into relative safe havens. TLT hit a new high and the 10-year Treasury Yield ($TNX) hit a new low. This week's low now marks key support at 128. Broken resistance and the July trend line mark first support in the 129.5 area.
**************************************************************************
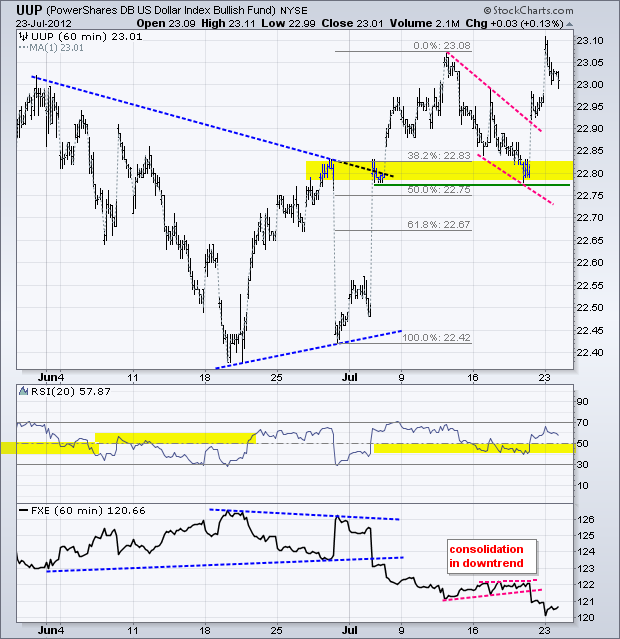
The US Dollar Fund (UUP) followed treasuries higher the last two days. Even though UUP closed below its open, the trend is clearly up after the early July triangle break and Friday's falling flag breakout. Key support remains in the 22.80 area and broken resistance turns first support in the 22.90 area.
**************************************************************************
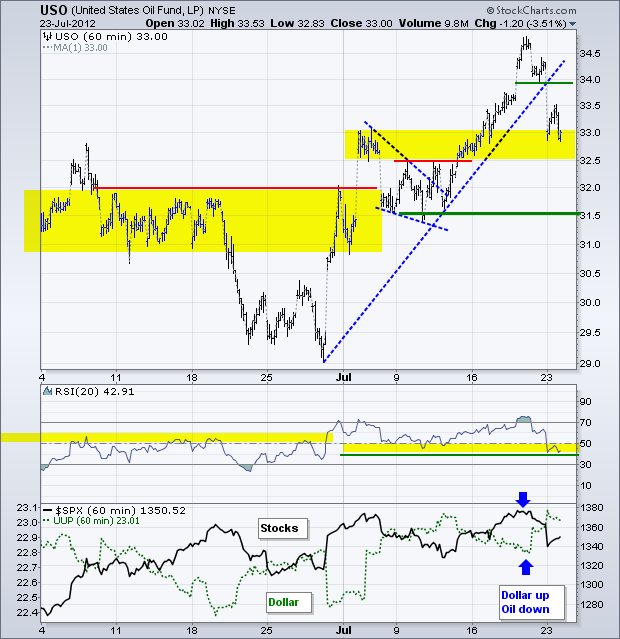
A strong Dollar and a risk-off market pushed overbought oil sharply lower on Monday. The US Oil Fund (USO) plunged to 33 with a 3.51% decline. Continued weakness in stocks and strength in the Dollar could push oil even further. USO is trading in its first support zone, which is marked by broken resistance. RSI is also trading in the 40-50 support zone. These are key areas to watch. Syria and Iran remain the big wild cards.
**************************************************************************
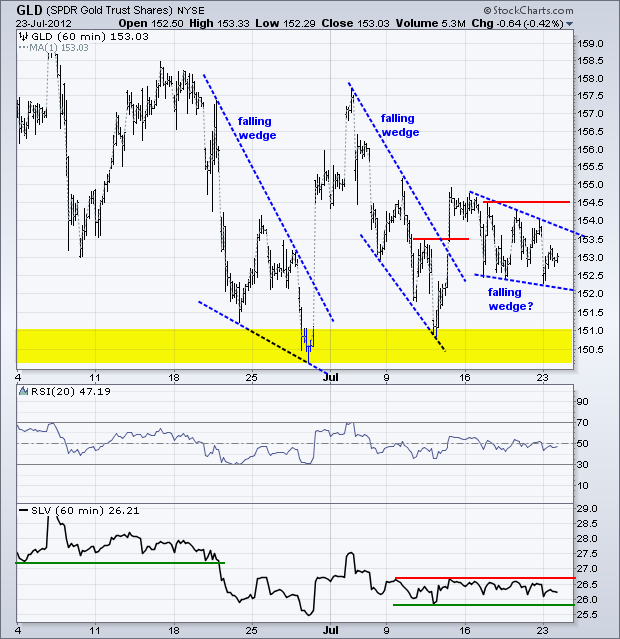
No change. Gold remains part of the risk off trade. This means a stronger Dollar and weaker stock market are negative for bullion. Moreover, gold peaked in August 2011 and remains in a long-term downtrend. The Gold SPDR (GLD) attempted to break falling wedge resistance, but failed to hold this breakout and is likely to test support in the 150.5-151 area soon. A smaller falling flag/wedge may be taking shape, but this needs to be confirmed with a breakout at 154.50.
**************************************************************************
Key Reports and Events:
Tue - Jul 24 - 10:00 - FHFA Housing Price Index
Wed - Jul 25 - 07:00 - MBA Mortgage Index
Wed - Jul 25 - 10:00 - New Home Sales
Wed - Jul 25 - 10:30 - Oil Inventories
Thu - Jul 26 - 08:30 - Jobless Claims
Thu - Jul 26 - 08:30 - Durable Good Orders
Thu - Jul 26 - 10:00 - Pending Home Sales
Fri - Jul 27 - 08:30 - GDP
Fri - Jul 27 - 09:55 - Michigan Sentiment
Charts of Interest: Tuesday and Thursday
This commentary and charts-of-interest are designed to stimulate thinking. This analysis is not a recommendation to buy, sell, hold or sell short any security (stock ETF or otherwise). We all need to think for ourselves when it comes to trading our own accounts. First, it is the only way to really learn. Second, we are the only ones responsible for our decisions. Think of these charts as food for further analysis. Before making a trade, it is important to have a plan. Plan the trade and trade the plan. Among other things, this includes setting a trigger level, a target area and a stop-loss level. It is also important to plan for three possible price movements: advance, decline or sideways. Have a plan for all three scenarios BEFORE making the trade. Consider possible holding times. And finally, look at overall market conditions and sector/industry performance.

