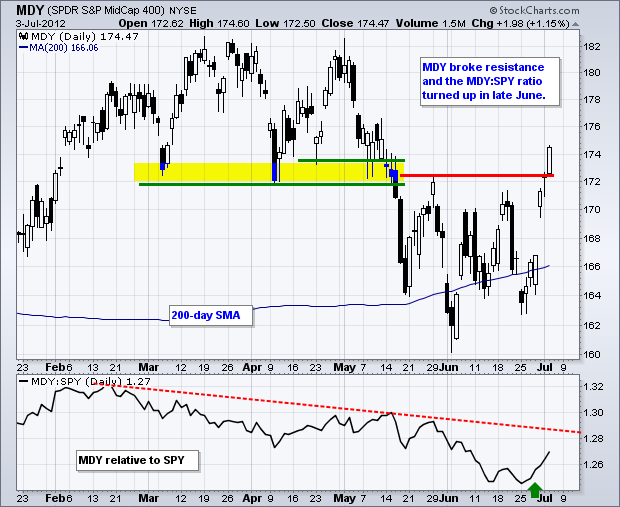
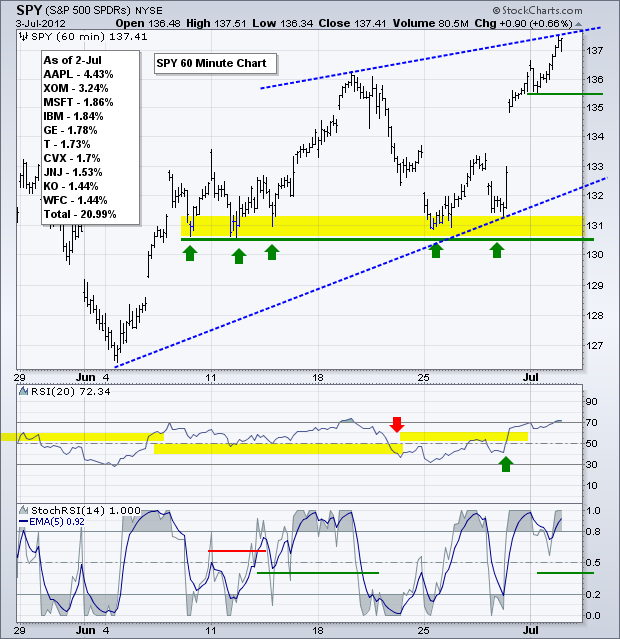
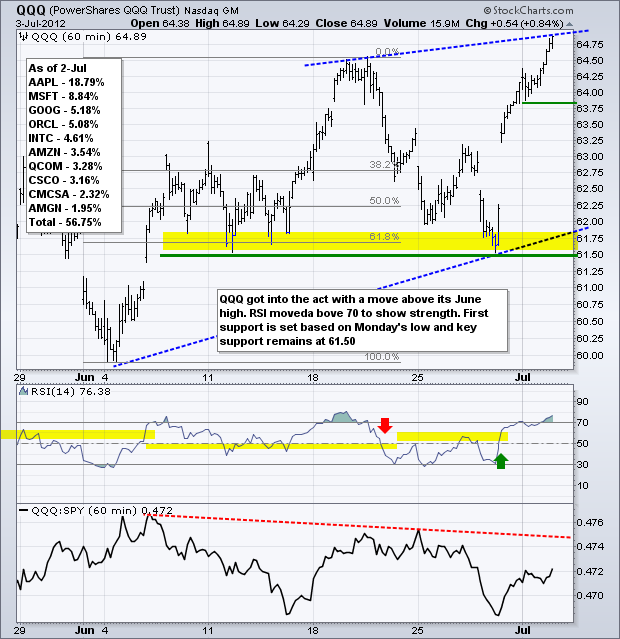
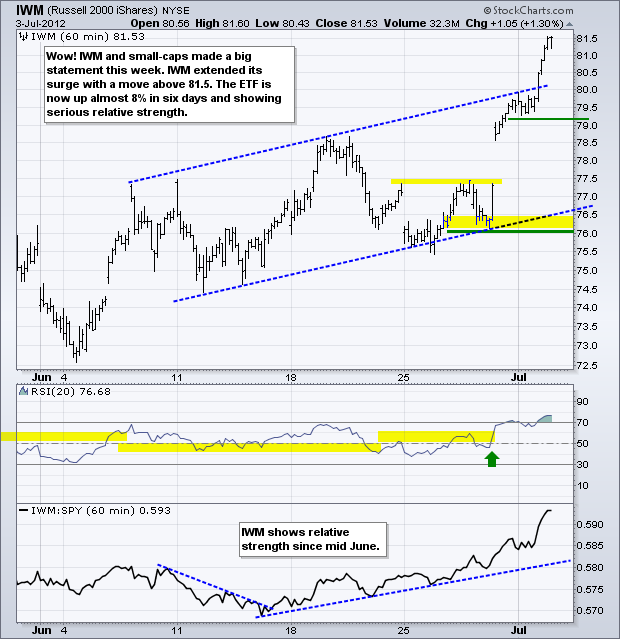
Stocks have been trending higher since early June and the major index ETFs extended these trends on Monday-Tuesday. Uptrends suggest that the path of least resistance is up, but an economic avalanche over the next two days could make-or-break said trends. The European Central Bank (ECB) and Bank of England (BOE) make their policy statements today, the US gets an employment preview with initial claims and an economic reality check with ISM Services. These two US reports will set the stage for Friday's employment report. The trend in economic data has been below expectations and more weakness would increase the chances of QE3. Will stocks rise on the expectations of QE3 or will stocks fall because of worse-than-expected data? That is the big question. Also note that the European Central Bank (ECB) is expected to lower rates. In a nutshell, central banks around the world are providing liquidity, which presents traders with a double-edged sword. The need for liquidity suggests underlying weakness in the economy and financial system, but such liquidity could translate into more money chasing stocks. The June-July advance in stocks tells us not to fight liquidity, at least for now. Small-caps and mid-caps must smell something positive because the Russell 2000 ETF (IWM) and S&P MidCap 400 SPDR (MDY) led the market higher the last five days. Notice that the S&P MidCap 400 SPDR (MDY) broke above resistance with a big move on Friday.
**************************************************************************
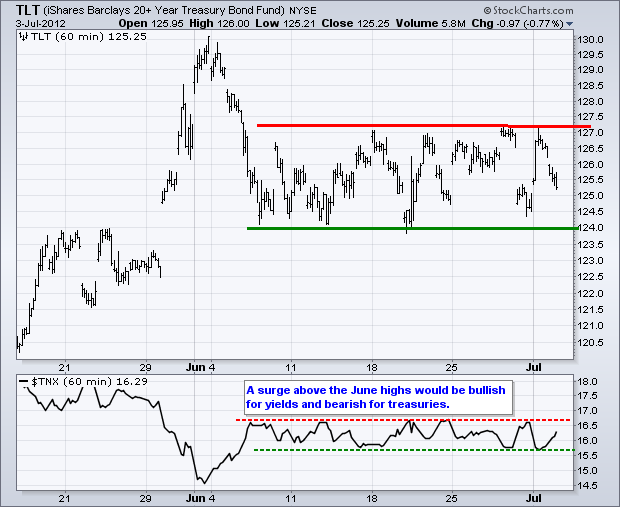
Treasuries cannot seem to make up their mind, but should make a clear decision by the end of this week. The 20+ Year T-Bond ETF (TLT) remains stuck in a trading range with support at 124 and resistance just above 127. The 10-year Treasury Yield ($TNX) is also stuck in a range since mid June. Worse-than-expected economic data and the prospects of more QE would likely push TLT above resistance. Better-than-expected economic data would push TLT below support. Stocks will likely take their cue from treasuries and move opposite of TLT.
**************************************************************************
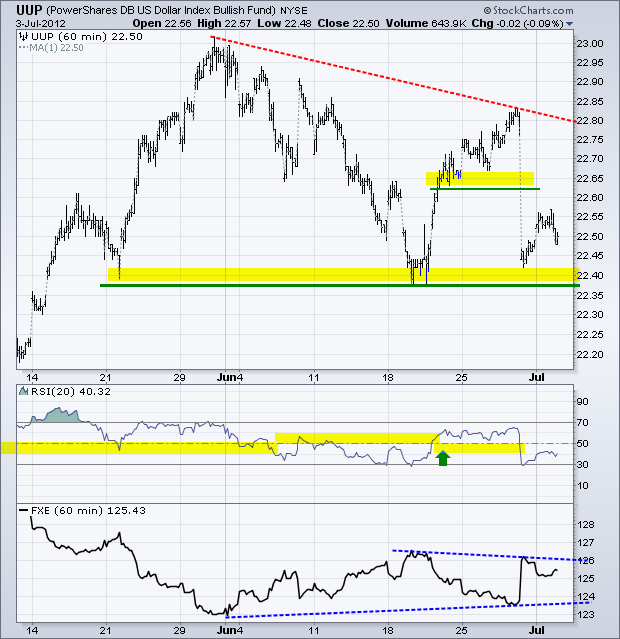
The European Central Bank (ECB) could jolt the Euro today and today's economic data could affect the Dollar. The US Dollar Fund (UUP) is trending down after a lower high last week and sharp decline. There is, however, a significant support zone around 24.4 and this level held. A break below support would further the downtrend.
**************************************************************************
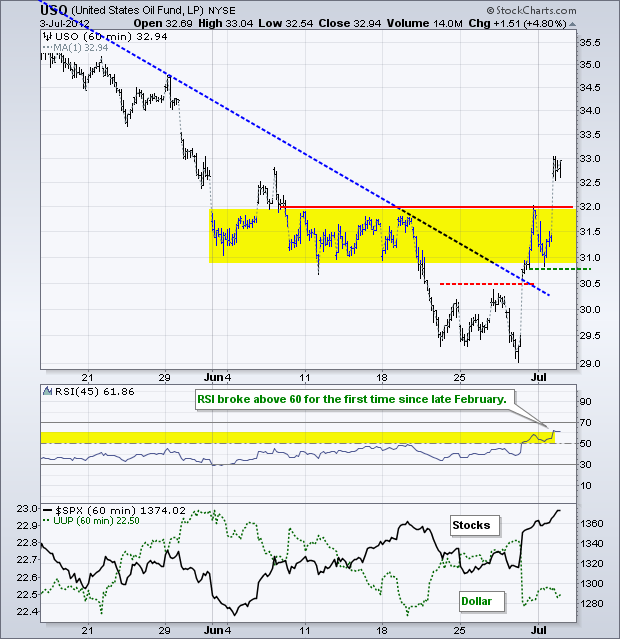
The US Oil Fund (USO) surged above resistance at 32 with the biggest three day advance since August 2009. The combination of Dollar weakness and stock market strength is pushing this risk asset higher. While USO is overbought, the breakout and surge are bullish. Moreover, this surge resembles the surge off the October lows. The June consolidation turns into the first support zone to watch on a throwback.
**************************************************************************
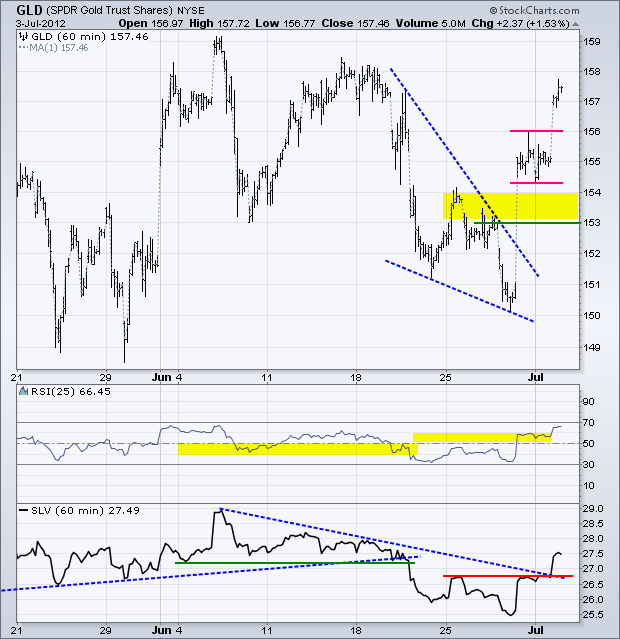
Gold continues to glitter as part of the risk-on trade. The Gold SPDR (GLD) broke falling wedge resistance with a big surge, consolidated and then continued higher. RSI also broke above 60 to turn momentum bullish and the Silver Trust (SLV) broke above resistance. The broken resistance zone in the 153-154 area turns first support.
**************************************************************************
Key Reports and Events:
Thu - Jul 05 - 07:00 - MBA Mortgage Index
Thu - Jul 05 - 07:30 - Challenger Job Cuts
Thu - Jul 05 - 10:00 – European Central Bank Policy Statement
Thu - Jul 05 - 08:15 - ADP Employment
Thu - Jul 05 - 08:30 - Initial Claims
Thu - Jul 05 - 10:00 - ISM Services
Thu - Jul 05 - 11:00 - Oil Inventories
Fri - Jul 06 - 08:30 - Employment Report
Charts of Interest: Tuesday and Thursday
This commentary and charts-of-interest are designed to stimulate thinking. This analysis is not a recommendation to buy, sell, hold or sell short any security (stock ETF or otherwise). We all need to think for ourselves when it comes to trading our own accounts. First, it is the only way to really learn. Second, we are the only ones responsible for our decisions. Think of these charts as food for further analysis. Before making a trade, it is important to have a plan. Plan the trade and trade the plan. Among other things, this includes setting a trigger level, a target area and a stop-loss level. It is also important to plan for three possible price movements: advance, decline or sideways. Have a plan for all three scenarios BEFORE making the trade. Consider possible holding times. And finally, look at overall market conditions and sector/industry performance.

