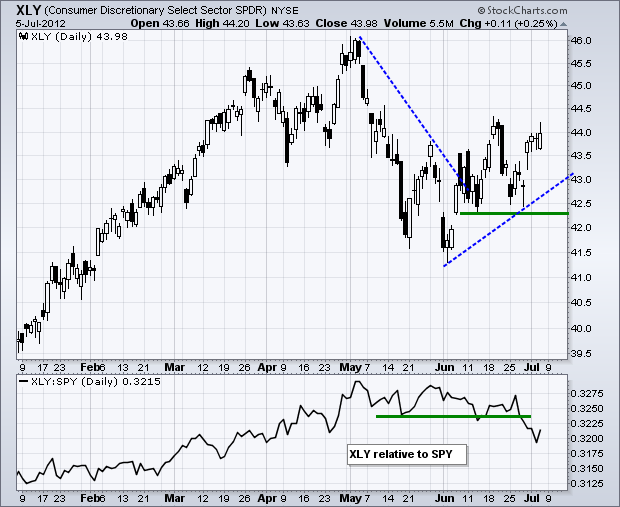
Central banks around the world continue to ease monetary policy and open the money spigots. The Bank of England increased its third quantitative easing program by 50 billion pounds, the European Central Bank (ECB) cut all kinds of rates on Thursday and China surprised the markets with another rate cut. The Fed is still sitting on the fence somewhat, but today's employment report could be the kicker. Even though it is hard to fight global liquidity, we must keep in mind that central banks are easing for a reason: sluggish economies. Slowing growth in China and contraction in Europe will certainly affect the US. My eyes remain on the Consumer Discretionary SPDR (XLY) for clues on the US economy and relative weakness is a concern. XLY surged last Friday and then stalled the last three days. In contrast to the S&P 500 ETF (SPY), XLY has yet to clear its mid June high and shows relative weakness. Notice that the Price Relative broke below its May-June lows this month.
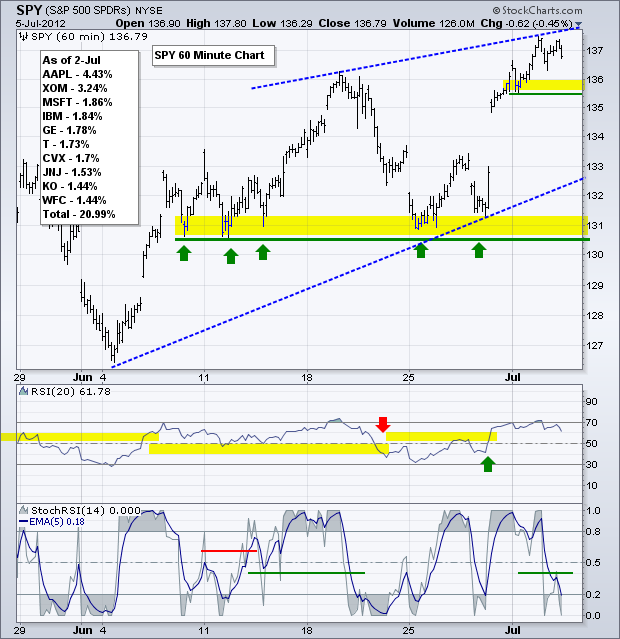
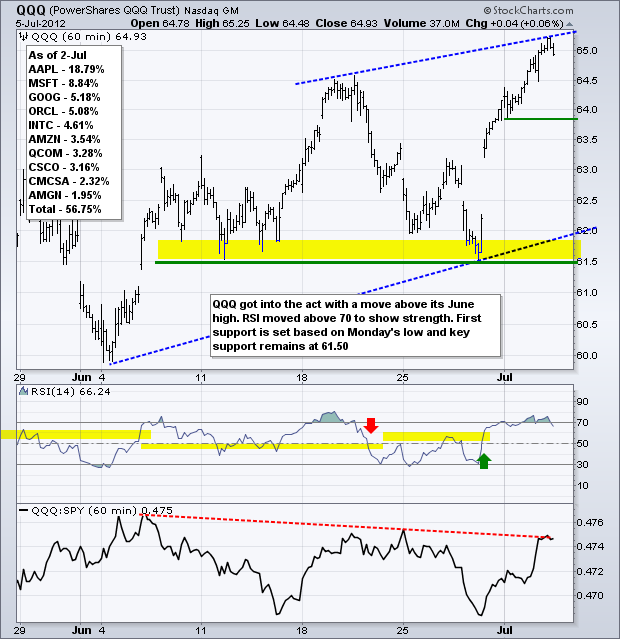
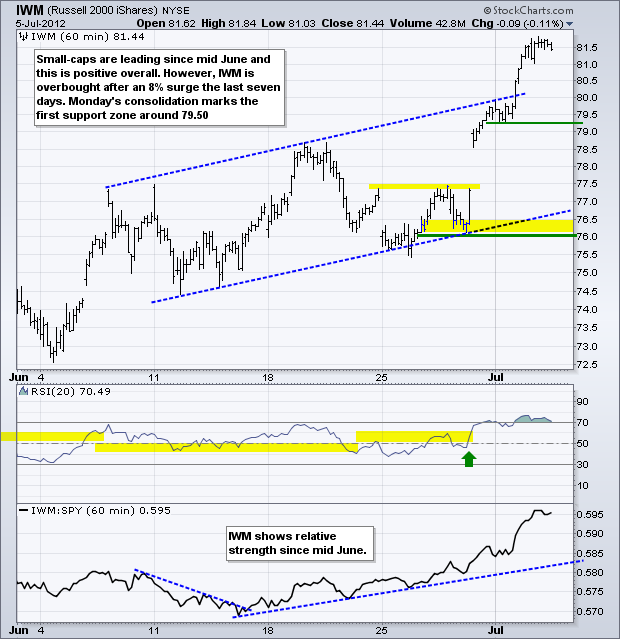
There is not much change on the 60-minute chart. SPY is holding the gap and trading just above the mid June highs. A large rising wedge could be taking shape, but we have yet to see a decisive decline that would mark the second peak. A move below Monday's low at 135.4 would forge such a peak and provide a bearish signal within the rising wedge. Such signals can be tricky because the trend is technically up as long as the wedge rises. A break below the mid June lows would fully reverse this uptrend.
**************************************************************************
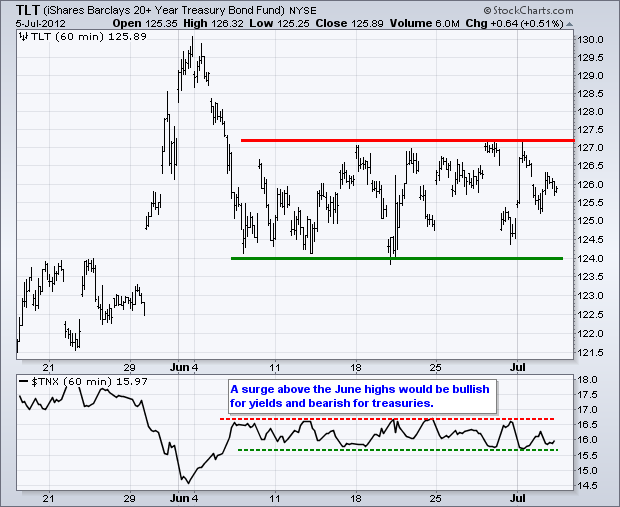
No change. Treasuries cannot seem to make up their mind, but should make a clear decision by the end of this week. The 20+ Year T-Bond ETF (TLT) remains stuck in a trading range with support at 124 and resistance just above 127. The 10-year Treasury Yield ($TNX) is also stuck in a range since mid June. Worse-than-expected economic data and the prospects of more QE would likely push TLT above resistance. Better-than-expected economic data would push TLT below support. Stocks will likely take their cue from treasuries and move opposite of TLT.
**************************************************************************
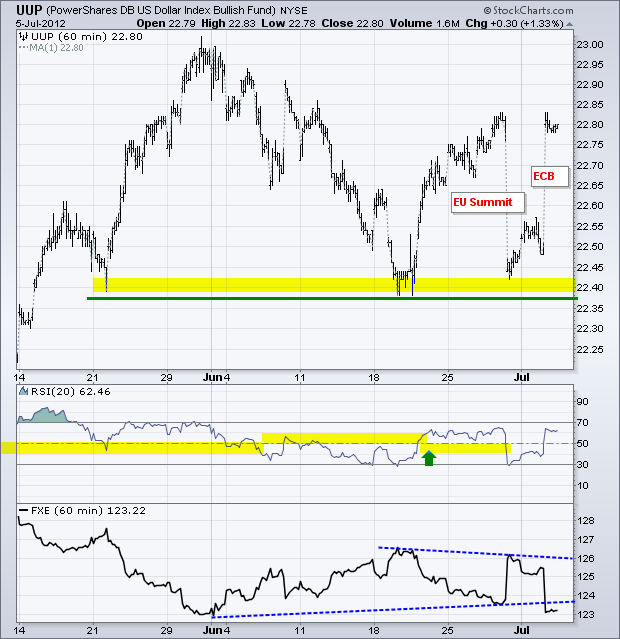
The US Dollar Fund (UUP) plunged around 1.5% with last week's EU summit and then surged right back to last week's highs with yesterday's European Central Bank (ECB) policy statement. Also note that Spanish bond yields are back near their pre-EU Summit levels. After holding out for a long time, the ECB finally cut rates and this pushed the Euro sharply lower. In the indicator window, the Euro Currency Trust (FXE) broke triangle support to signal a continuation lower. This is Dollar bullish.
**************************************************************************
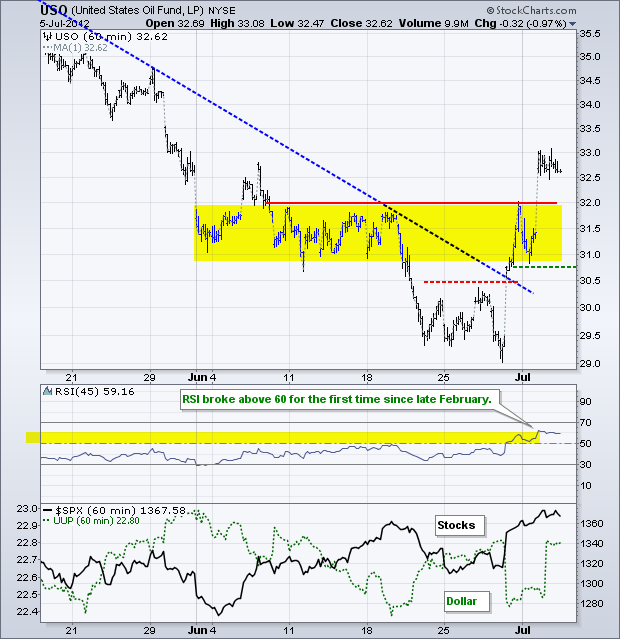
No change. The US Oil Fund (USO) surged above resistance at 32 with the biggest three day advance since August 2009. The combination of Dollar weakness and stock market strength is pushing this risk asset higher. While USO is overbought, the breakout and surge are bullish. Moreover, this surge resembles the surge off the October lows. The June consolidation turns into the first support zone to watch on a throwback.
**************************************************************************
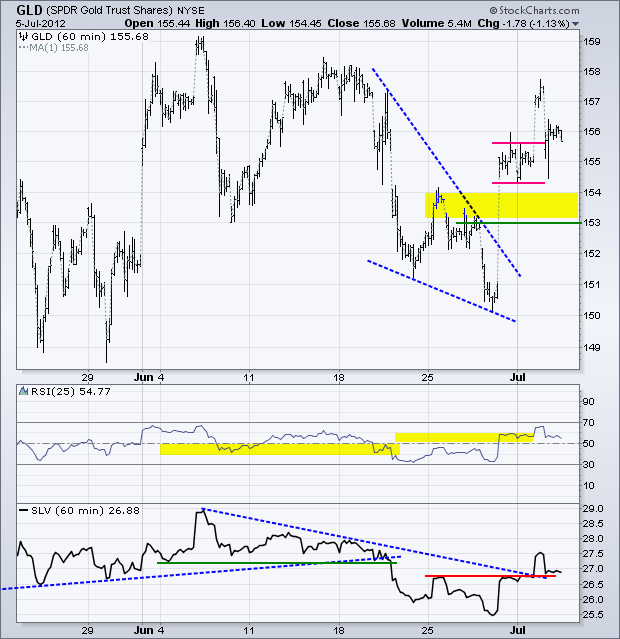
No change. Gold continues to glitter as part of the risk-on trade. The Gold SPDR (GLD) broke falling wedge resistance with a big surge, consolidated and then continued higher. RSI also broke above 60 to turn momentum bullish and the Silver Trust (SLV) broke above resistance. The broken resistance zone in the 153-154 area turns first support.
**************************************************************************
Key Reports and Events:
Fri - Jul 06 - 08:30 - Employment Report
Charts of Interest: Tuesday and Thursday
This commentary and charts-of-interest are designed to stimulate thinking. This analysis is not a recommendation to buy, sell, hold or sell short any security (stock ETF or otherwise). We all need to think for ourselves when it comes to trading our own accounts. First, it is the only way to really learn. Second, we are the only ones responsible for our decisions. Think of these charts as food for further analysis. Before making a trade, it is important to have a plan. Plan the trade and trade the plan. Among other things, this includes setting a trigger level, a target area and a stop-loss level. It is also important to plan for three possible price movements: advance, decline or sideways. Have a plan for all three scenarios BEFORE making the trade. Consider possible holding times. And finally, look at overall market conditions and sector/industry performance.

