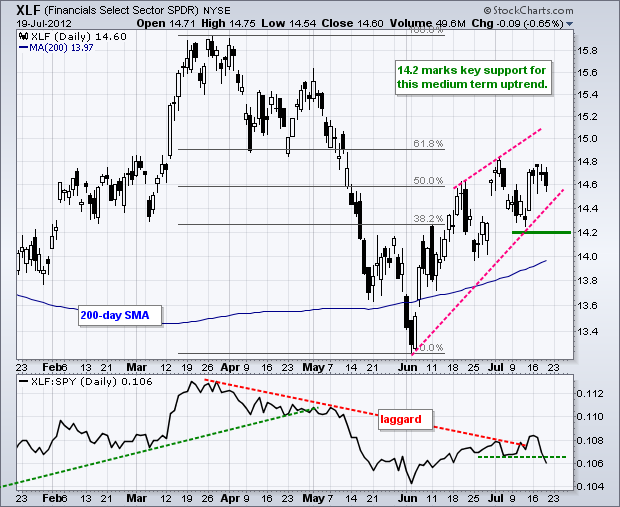
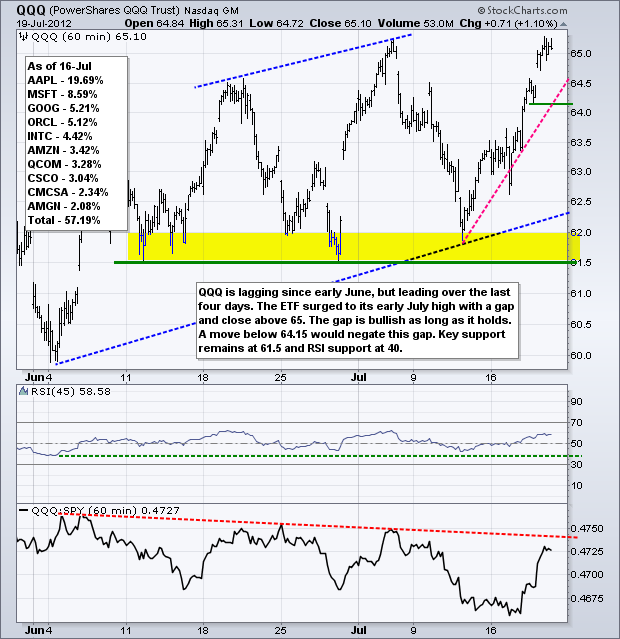
Technology stocks led the market again on Thursday, but the finance sector weakened again and small-caps were also down on the day. Relative weakness in these two is not a good sign. At best, it points to a divided market that will trade sideways. At worst, it points to underlying weakness that will eventually engulf the rest of the market. You can see relative weakness in IWM on the 60-minute chart further down. The Finance SPDR (XLF) failed to exceed the early July high and the price relative broke below its early July low.
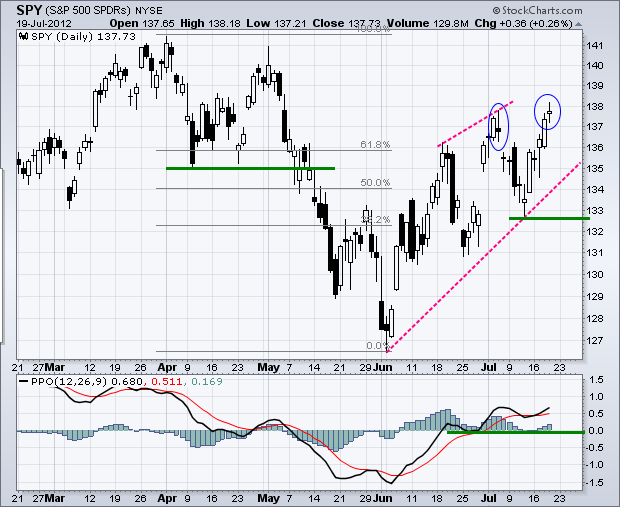
Even though the S&P 500 ETF (SPY) moved higher on the day, the ETF finished with an indecisive doji. These candlesticks have small, very small, bodies that show little change from open to close. In addition, they form with relatively equal upper and lower shadows marking the high-low range. Basically, SPY ended where it started the day and in the middle of its high-low range. Indecision is the first step to a reversal, just as it was with the harami in early July.
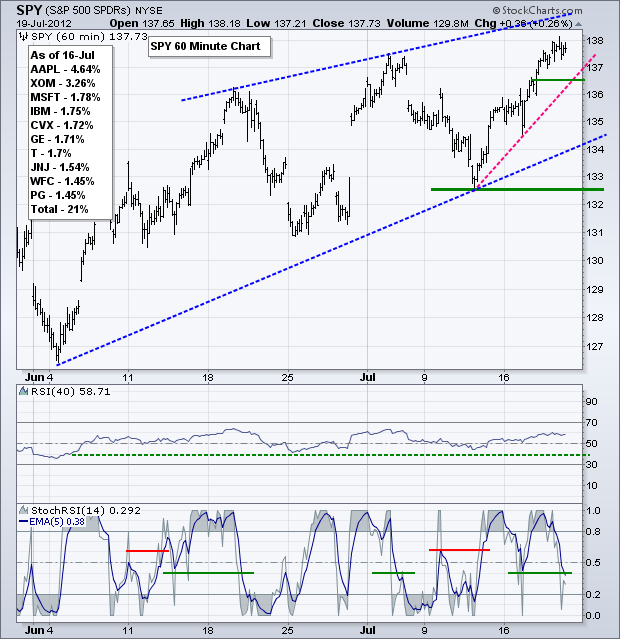
There is not much change on the 60-minute chart for SPY. The ETF remains in medium-term and short-term uptrends. There are three up legs to the advance since early June. The first leg had the strongest upside momentum and momentum has deteriorated on the last two. The pink trend line marks the current up leg and first support at 136.5. A move below this level would signal a short-term trend reversal within the bigger rising wedge. Key support remains at 132.50. In the indicator window, the 5-period EMA of StochRSI broke below .40 to signal slowing upside momentum. This is a very EARLY bearish signal from a very SENSITIVE indicator. "Early" and "sensitive" are the key words. This indicator produces great signals, but can also strike out – just like home run hitters.
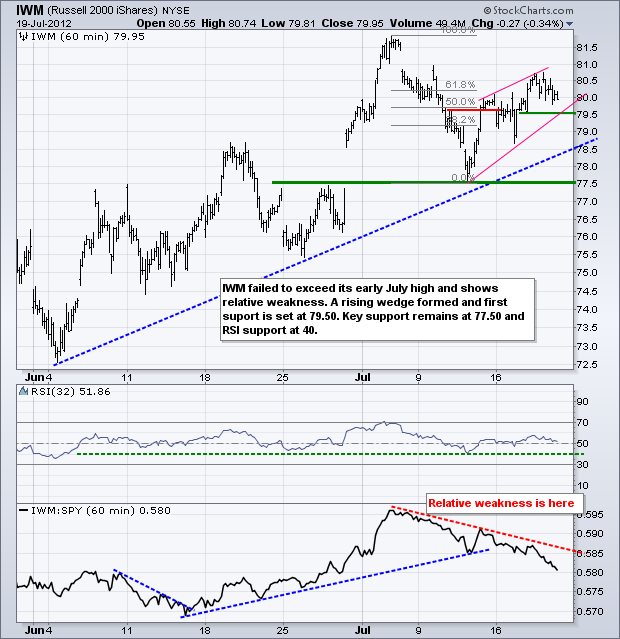
**************************************************************************
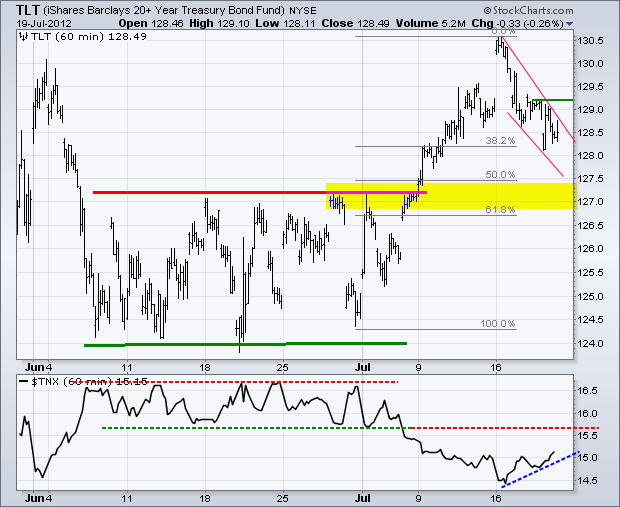
The 20+ Year T-Bond ETF (TLT) retreated this week to give the stock market its opening. However, this retreat still looks like a correction within a bigger uptrend. Broken resistance and the 50-61.80% retracement zone mark support in the 127-127.5 area. A falling wedge has taken shape this week with first resistance at 129.20.
**************************************************************************
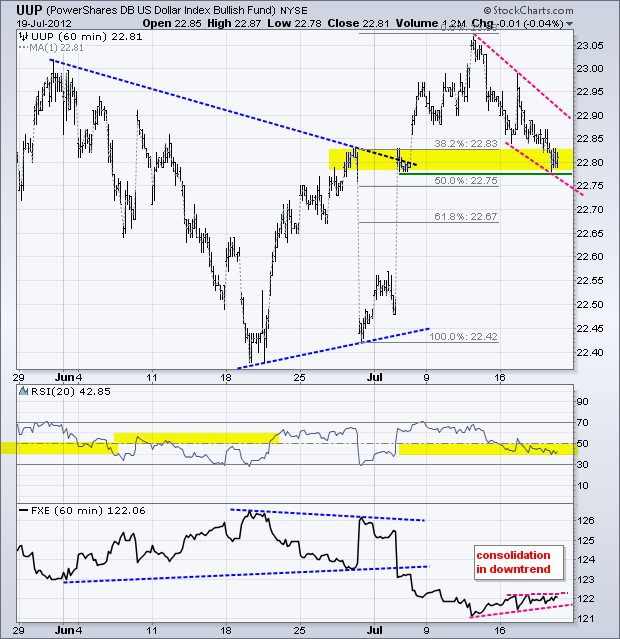
The US Dollar Fund (UUP) followed treasuries lower as the risk-on trade took hold this week. A falling wedge has developed and the ETF is near support from broken resistance and the 50% retracement line. Also notice that RSI is in its support zone. This is the moment-of-truth for the correction. A break above the upper trend line of the falling wedge would signal a continuation higher.
**************************************************************************
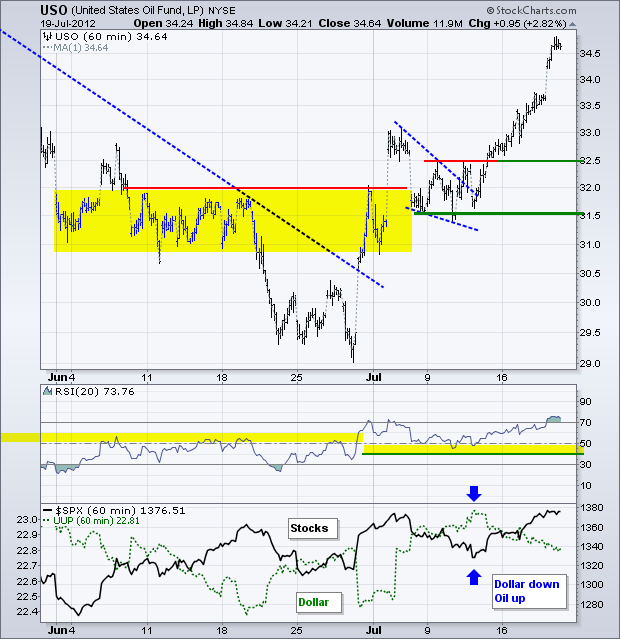
Weakness in the Dollar and chaos in Syria is pushed money into oil the last several days. The oil markets are unsure how regime change will affect this volatile region and Iran, one of Syria's biggest supporters. The US Oil Fund (USO) broke falling wedge resistance and surged above 34.50 with a big move on Thursday. Oil is getting overbought, but in a clear uptrend.
**************************************************************************
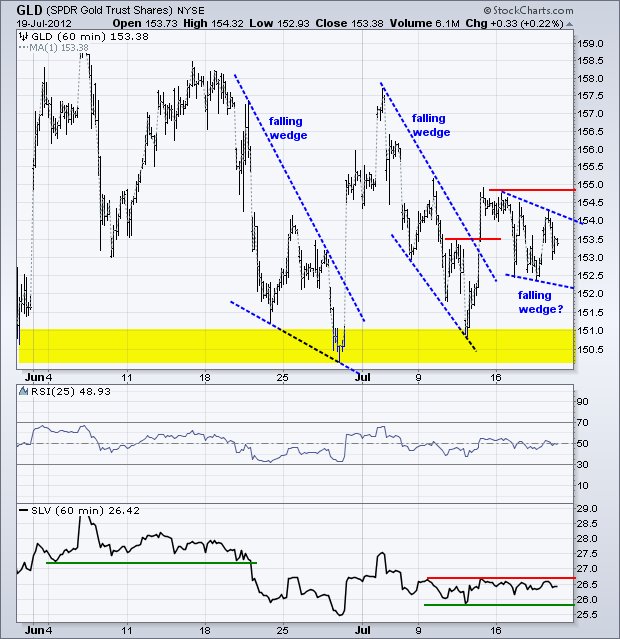
The Gold SPDR (GLD) surged above falling wedge resistance with a move above 153.5 last week, but failed to continue higher and hold this breakout. Keep in mind that this failure occurred when the Dollar was weak and the stock market strong. Gold is a bit confused right now. A smaller falling wedge/flag is taking shape and a break above this week's high would signal a continuation of last week's surge. At this stage, the onus is on the bulls to prove the bears wrong.
**************************************************************************
Key Reports and Events:
Fri - Jul 20 - 08:00 - TGIF
Charts of Interest: Tuesday and Thursday
This commentary and charts-of-interest are designed to stimulate thinking. This analysis is not a recommendation to buy, sell, hold or sell short any security (stock ETF or otherwise). We all need to think for ourselves when it comes to trading our own accounts. First, it is the only way to really learn. Second, we are the only ones responsible for our decisions. Think of these charts as food for further analysis. Before making a trade, it is important to have a plan. Plan the trade and trade the plan. Among other things, this includes setting a trigger level, a target area and a stop-loss level. It is also important to plan for three possible price movements: advance, decline or sideways. Have a plan for all three scenarios BEFORE making the trade. Consider possible holding times. And finally, look at overall market conditions and sector/industry performance.

About the author:
Arthur Hill, CMT, is the Chief Technical Strategist at TrendInvestorPro.com. Focusing predominantly on US equities and ETFs, his systematic approach of identifying trend, finding signals within the trend, and setting key price levels has made him an esteemed market technician. Arthur has written articles for numerous financial publications including Barrons and Stocks & Commodities Magazine. In addition to his Chartered Market Technician (CMT) designation, he holds an MBA from the Cass Business School at City University in London.
Learn More


