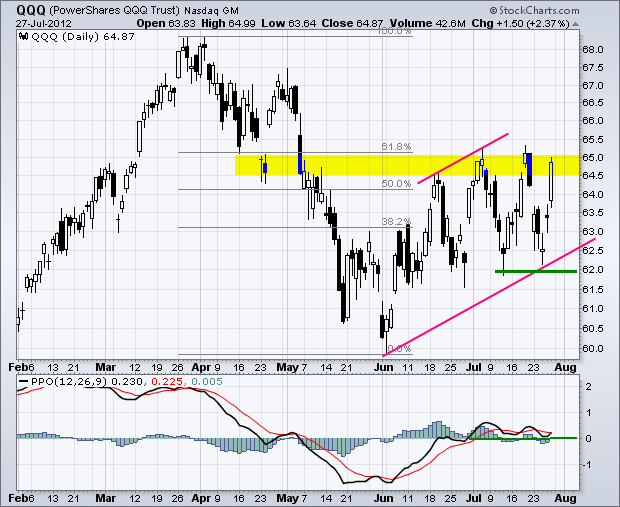
Mario Draghi said the magic words and stocks answered with a powerful surge higher. The rally started on Thursday and extended on Friday. The Russell 2000 ETF (IWM) and Nasdaq 100 ETF (QQQ) led the charge with 2+ percent gains. All sectors were higher the Technology SPDR (XLK), Industrials SPDR (XLI) and Healthcare SPDR (XLV) gaining over 2%. These gains made up for the losses experienced early in the week and the major index ETFs are once again near their summer highs. QQQ is challenging resistance in the 65 area for the fourth time since mid June. Also notice that the Percent Price Oscillator (PPO) is holding in positive territory to keep medium-term momentum bullish.
Before getting to the intraday charts, note that this week is HUGE on the economic reporting front. There are some 17 reports due this week. In addition, the Fed meets on Tuesday-Wednesday and the European Central Bank (ECB) convenes on Thursday. The week will be capped off with the ISM Services Index and the employment report. Stocks surged last week as ECB President Mario Draghi promised to support the Euro. With a little relief coming out of Europe, it is now time for the US economy to show its stuff. Economic reports have been weak the last four months with most reports coming in below expectations. This needs to change if stocks are to hold last week's gains.
On the 60-minute chart, SPY remains in a medium-term uptrend with a series of higher highs and higher lows. This zigzag higher with littered with gaps, both up and down. The blue circles show big reversals formed with up gaps that erased prior down gaps. With Thursday's gap and Friday's surge, SPY is trading at a new high for the month and near the upper trend line of the rising channel. SPY is already short-term overbought, but a break above this trend line could trigger an acceleration higher. Key support is marked in the 132.5-133 area. 40-period RSI held the 40-50 zone for the third time since late June to keep momentum bullish. A break below 40 would reverse the medium-term uptrend.


**************************************************************************
The 20+ Year T-Bond ETF (TLT) plunged as money moved out of this safe-haven and into riskier assets. Note that this plunge is based on comments from the ECB, not on a change in the economic outlook for the US. This week could be the decider as TLT hits a support zone from broken resistance in the 127 area.

**************************************************************************
The Euro surge and the Dollar plunged as the European Central Bank (ECB) pledged to support the Euro. The US Dollar Fund (UUP) fell sharply and broke support at 22.80 on Friday. The last sharp decline occurred in late June after the EU summit. UUP rebounded in early July and then surged to new highs. I still think the bigger trend is up for UUP and the ETF may find support near the 61.80% retracement level.

**************************************************************************
The US Oil Fund (USO) broke falling wedge resistance, but did not surge with the stock market on Friday. The inability to rise along with stocks and the Euro could be a negative. The falling wedge breakout is holding for now. I am marking key support at 32.5 and RSI support at 40. These two levels hold the key to the current uptrend.

**************************************************************************
Strength in the Euro and stock market carried over to gold as the Gold SPDR (GLD) surged above the triangle trend line. The gap and wedge breakout held. More importantly, GLD followed through on this breakout. The gap zone and breakout mark the first support zone to watch. A move back below 153.5 would negate this move. Key support remains at 152 for now.

**************************************************************************
Key Reports and Events:
Tue - Jul 31 - 08:30 - Personal Income & Spending
Tue - Jul 31 - 09:00 - Case-Shiller Housing Index
Tue - Jul 31 - 09:00 – FOMC Meeting Begins
Tue - Jul 31 - 09:45 - Chicago Purchasing Managers Index (PMI)
Tue - Jul 31 - 10:00 - Consumer Confidence
Wed - Aug 01 - 07:00 - MBA Mortgage Index
Wed - Aug 01 - 08:15 - ADP Employment Report
Wed - Aug 01 - 10:00 - ISM Manufacturing Index
Wed - Aug 01 - 10:00 - Construction Spending
Wed - Aug 01 - 10:30 - Crude Inventories
Wed - Aug 01 - 14:00 - Auto/Truck Sales
Wed – Aug 01 - 12:30 – FOMC Policy Statement
Thu - Aug 02 - 07:30 - Challenger Job Cuts
Thu - Aug 02 - 08:30 - Jobless Claims
Thu - Aug 02 - 10:00 - Factory Orders
Thu - Aug 02 - 10:00 – European Central Bank (ECB) Meeting
Fri - Aug 03 - 10:00 - ISM Services Index
Fri – Aug 03 - 08:30 – Employment Report
Fri – Aug 31 – 09:00 – Jackson Hole Central Bank Symposium
Charts of Interest: Tuesday and Thursday
This commentary and charts-of-interest are designed to stimulate thinking. This analysis is not a recommendation to buy, sell, hold or sell short any security (stock ETF or otherwise). We all need to think for ourselves when it comes to trading our own accounts. First, it is the only way to really learn. Second, we are the only ones responsible for our decisions. Think of these charts as food for further analysis. Before making a trade, it is important to have a plan. Plan the trade and trade the plan. Among other things, this includes setting a trigger level, a target area and a stop-loss level. It is also important to plan for three possible price movements: advance, decline or sideways. Have a plan for all three scenarios BEFORE making the trade. Consider possible holding times. And finally, look at overall market conditions and sector/industry performance.


