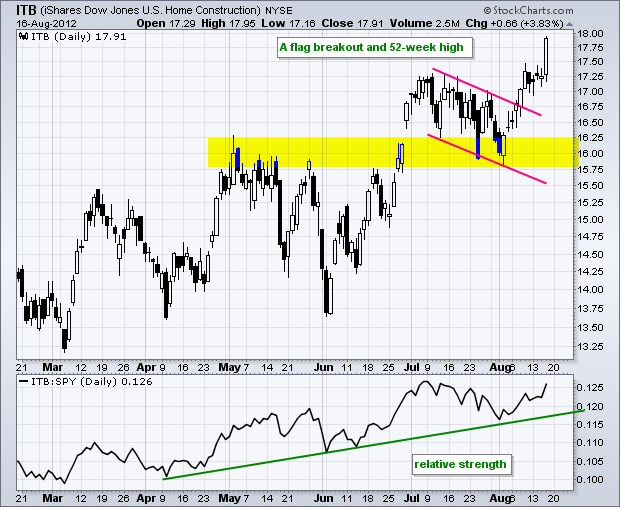
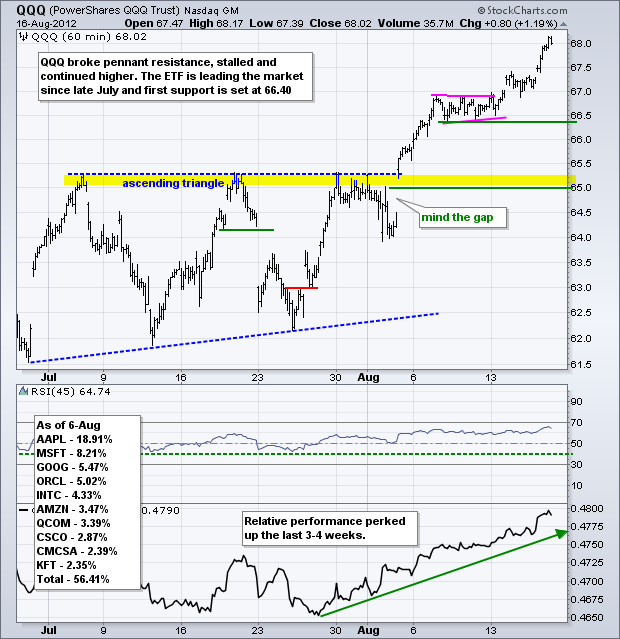
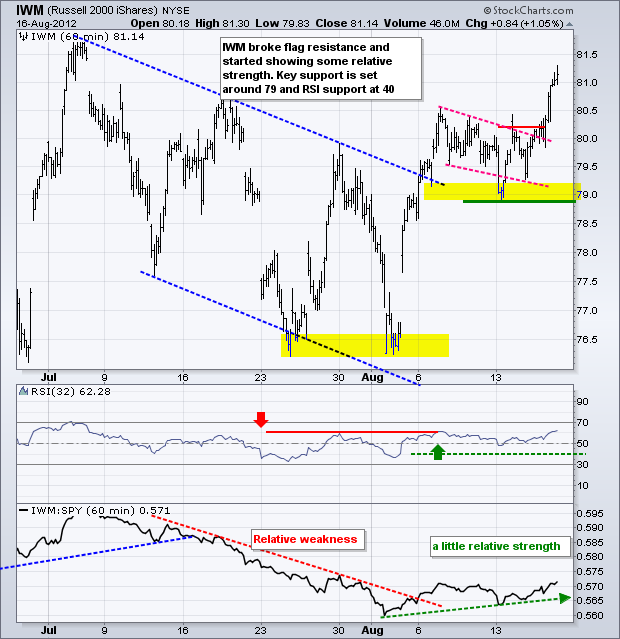
Stocks caught a bid on Thursday and closed modestly higher. The Nasdaq 100 ETF (QQQ) and Russell 2000 ETF (IWM) led the way by gaining over 1%. All sectors were up with technology and materials scoring the biggest gains. A big gain in the Home Construction iShares (+3.83%) helped the consumer discretionary sector to a modest gain. Housing remains one of the hottest groups in the market right now. Gold, oil and the Euro moved higher as money moved into riskier assets. Treasuries continued their slide as the prospects for further quantitative easing diminished.
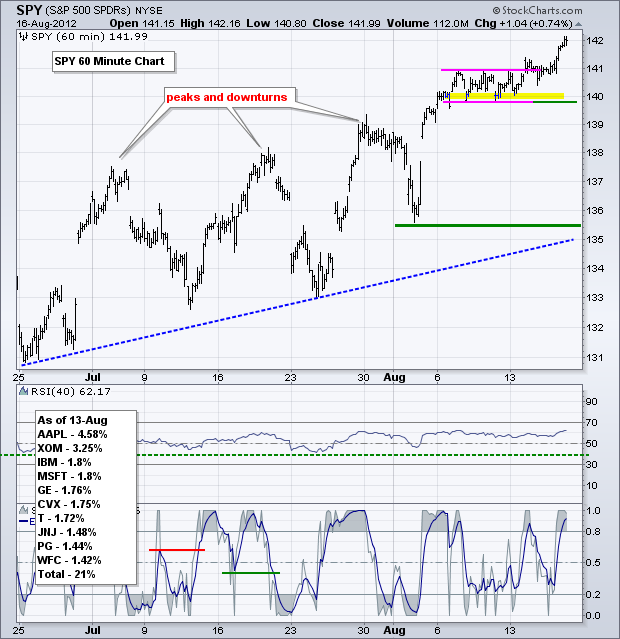
The uptrend extended on the SPY 60-minute chart. The ETF broke flag resistance earlier this week, stalled around the breakout and then continued to 142 on Thursday. This move reinforces the uptrend and support in the 140 area. The bulls showed their mettle as SPY surged in early August and held its gains for a week before continuing higher. After the prior three surges, SPY peaked and moved lower within a few days. The ability to hold the gains with a consolidation showed underlying strength.
**************************************************************************
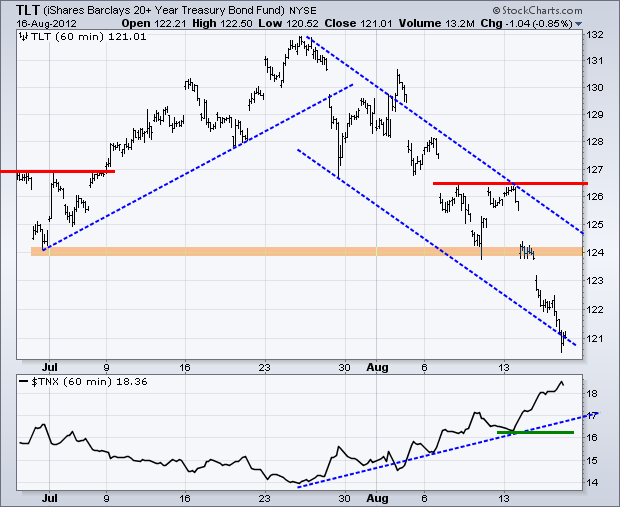
Treasuries continued their freefall as the 20+ Year T-Bond ETF (TLT) fell to the lower trend line of the falling channel. TLT is oversold, but still in the falling knife category. Broken support turns first resistance in the 124 area.
**************************************************************************
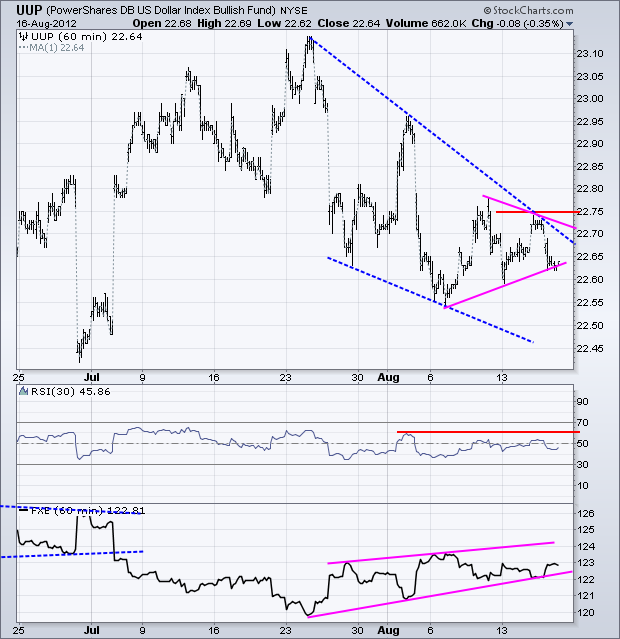
The Dollar dropped as the risk-on trade took hold, but managed to firm after initial weakness. Overall, the trend is down as the US Dollar Fund (UUP) remains within a falling wedge. A triangle is taking shape the last few days with support around 22.60 and resistance at 22.75. Watch these levels for the next break.
**************************************************************************
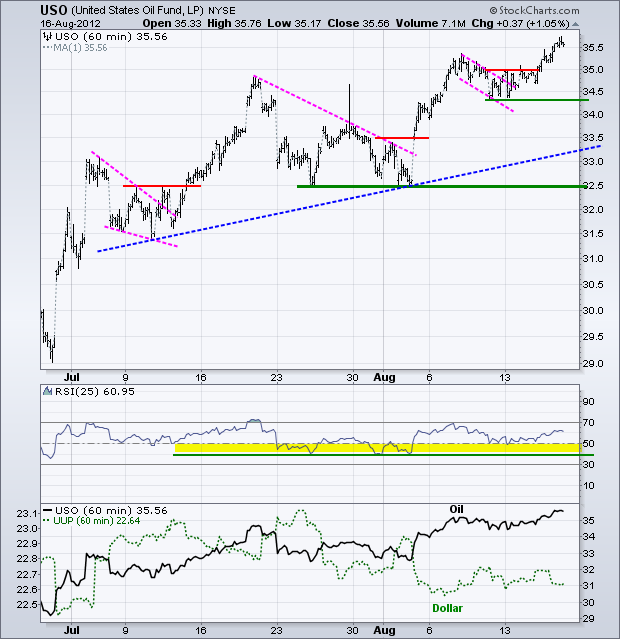
A drop in the Dollar and rise in the stock market helped oil as the US Oil Fund (USO) extended its flag breakout. The extension has been rather modest, but USO is moving in the right direction. The flag lows mark first support at 34.30 and RSI marks support in the 40-50 zone.
**************************************************************************
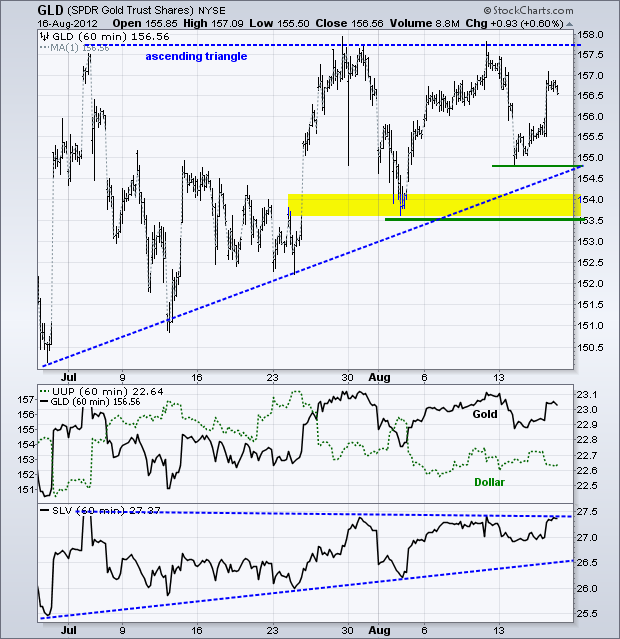
The Gold SPDR (GLD) also benefitted from a weak Dollar and strong stock market. GLD bounced off the 155 level to keep the ascending triangle alive with a higher low. A breakout is still needed to confirm the pattern. I am leaving key support at 153.50 for now.
**************************************************************************
Key Reports and Events:
Fri - Aug 17 - 09:55 - Michigan Sentiment
Fri - Aug 17 - 10:00 - Leading Economic Indicators
Fri – Aug 31 – 09:00 – Jackson Hole Central Bank Symposium
Charts of Interest: Tuesday and Thursday
This commentary and charts-of-interest are designed to stimulate thinking. This analysis is not a recommendation to buy, sell, hold or sell short any security (stock ETF or otherwise). We all need to think for ourselves when it comes to trading our own accounts. First, it is the only way to really learn. Second, we are the only ones responsible for our decisions. Think of these charts as food for further analysis. Before making a trade, it is important to have a plan. Plan the trade and trade the plan. Among other things, this includes setting a trigger level, a target area and a stop-loss level. It is also important to plan for three possible price movements: advance, decline or sideways. Have a plan for all three scenarios BEFORE making the trade. Consider possible holding times. And finally, look at overall market conditions and sector/industry performance.

About the author:
Arthur Hill, CMT, is the Chief Technical Strategist at TrendInvestorPro.com. Focusing predominantly on US equities and ETFs, his systematic approach of identifying trend, finding signals within the trend, and setting key price levels has made him an esteemed market technician. Arthur has written articles for numerous financial publications including Barrons and Stocks & Commodities Magazine. In addition to his Chartered Market Technician (CMT) designation, he holds an MBA from the Cass Business School at City University in London.
Learn More
