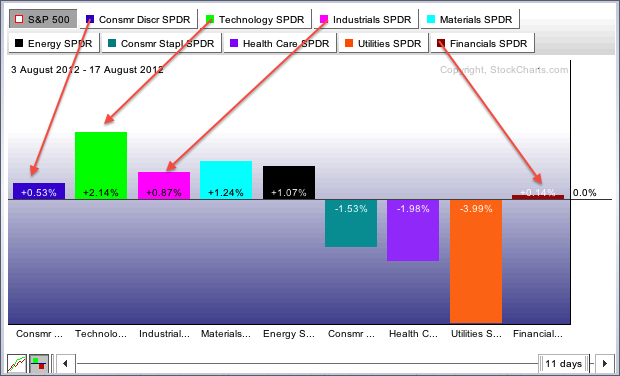
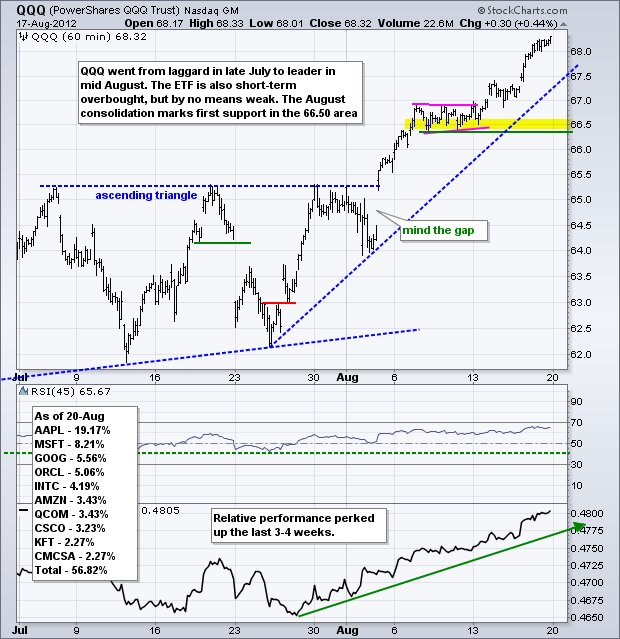
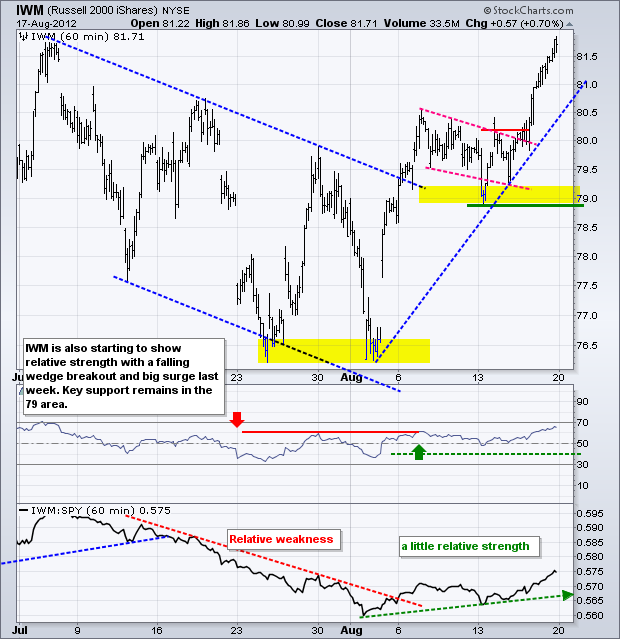
Stocks meandered on Friday and got a lift in the final hour to finish the week on a positive note. The Russell 2000 ETF (IWM) led the way with a .70% gain. The Dow Industrials SPDR (DIA) lagged with a .11% loss. Five of the nine sectors were higher. Of note, the offensive sectors showed relative strength and the defensive sectors showed relative weakness. As the Sector PerfChart shows, this has been the case since early August. XLY, XLK, XLI and XLF are outperforming the S&P 500, while XLP, XLU and XLV are underperforming. Relative strength in the offensive sectors is positive because it shows an appetite for risk.
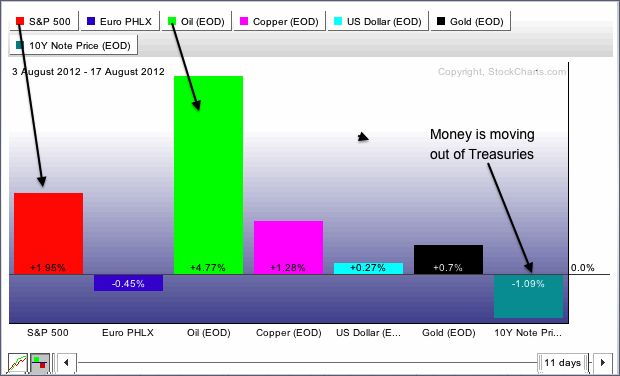
The intermarket PerfChart is a little more mixed. The S&P 500 and oil are sharply higher since early August, and 10-year Treasuries are sharply lower. Copper and gold are also up over the last three weeks. Overall, weakness in treasuries and strength in stocks/commodities favors the risk-on trade. The Dollar, however, is the wild card because the greenback shows a small gain and the Euro shows a small loss. Dollar strength usually favors the risk-off trade, but stocks and oil are ignoring Dollar strength right now. Gold, on the other hand, remains under pressure because the Dollar is holding firm.
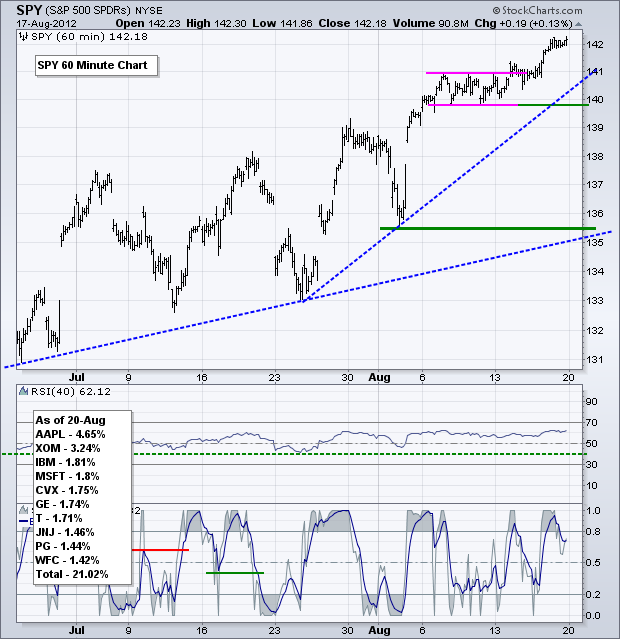
There is no real change on the 60-minute chart for SPY. The ETF remains a bit overbought, but shows no signs of selling pressure. SPY was overbought when it moved above 140. Instead of the normal surge-peak-pullback cycle, the ETF simply consolidated with a flat trading range and broke resistance last week. This breakout reinforces support in the 140-141 area, which is also confirmed by the late July trend line.
**************************************************************************
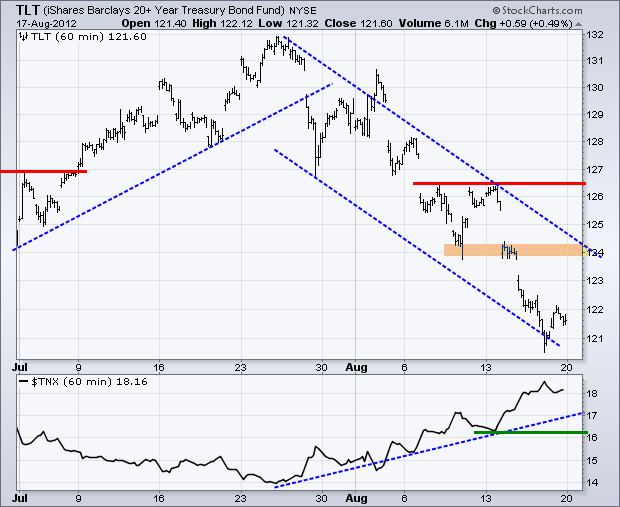
Treasury bonds are the most oversold since mid March, which happen to mark a signifciant low. On the daily chart, the Commodity Channel Index (CCI) dipped below -200 in early August and RSI moved below 30 last week. These oversold readings are rare for any security and they argue for a bounce. TLT hit the lower trend line of a falling channel and got a small bounce on Thursday. A move to the upper trend line and broken support is possible (±124).
**************************************************************************
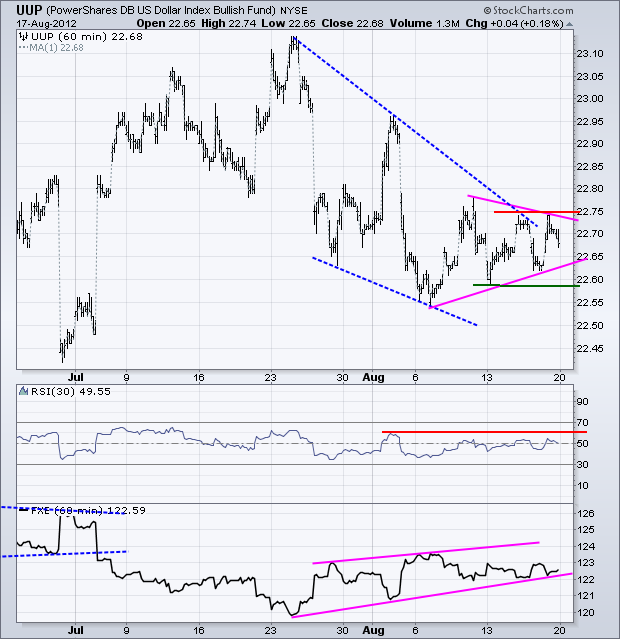
It could be a big week for the Euro and the Dollar as EU leaders start talking again. French President Francois Hollande and German Chancellor Angela Merkel are scheduled to meet in Berlin on Thursday. This meeting will be followed by individual meetings with Greek Prime Minister Antonis Samaras on Friday and Saturday. There is also talk that the ECB will attempt to cap bond yields. On the chart, the US Dollar Fund (UUP) had a falling wedge working, but triangle consolidation has supplanted this pattern. Last week's range marks resistance and support. Watch these levels for the next directional clue.
**************************************************************************
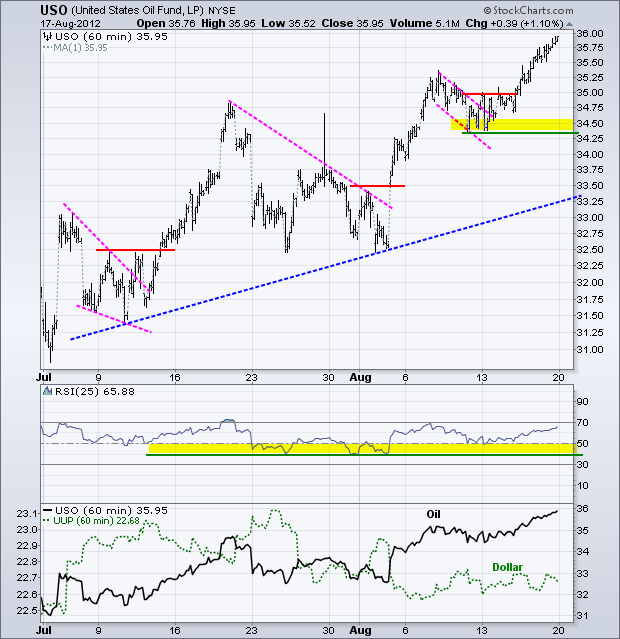
Oil is moving higher along with the stock market. Tensions in the Middle East could also be fueling the rise in oil. On the price chart, the US Oil Fund (USO) broke flag resistance early last week and continued higher throughout the week. The flag low turns into the first support zone to watch around 34.50. RSI support remains in the 50-60 zone.
**************************************************************************
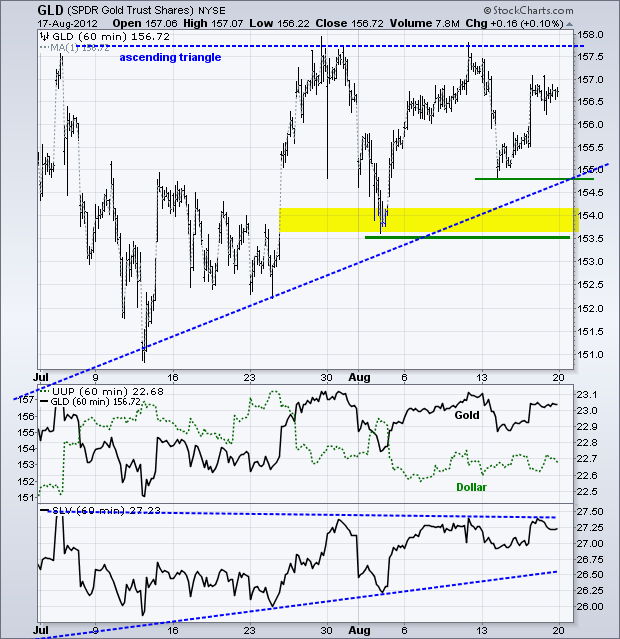
A big week for Euro/Dollar could mean a big week for gold. Strength in the Dollar would be negative for bullion, while weakness would be positive. There is not much change on the price chart. The Gold SPDR (GLD) is near resistance from the highs extending back to early June. A break above 158 would be bullish, both medium-term and short-term. There is a slight short-term uptrend with the rising lows since mid July, but resistance is proving stiff. First support is set with the July trend line and last week's low (154.8). Key support remains at 153.50
**************************************************************************
Key Reports and Events:
Tue - Aug 21 - 14:00 - FOMC Minutes
Wed - Aug 22 - 07:00 - MBA Mortgage Index
Wed - Aug 22 - 10:00 - Existing Home Sales
Wed - Aug 22 - 10:30 - Crude Inventories
Thu - Aug 23 - 08:30 – Hollande & Merkel Meet in Berlin
Thu - Aug 23 - 08:30 - Initial Claims
Thu - Aug 23 - 10:00 - New Home Sales
Fri - Aug 24 - 08:30 – Samaras & Merkel Meet in Berlin
Fri - Aug 24 - 08:30 - Durable Orders
Sat - Aug 25 - 08:30 – Samaras & Hollande Meet in Paris
Fri – Aug 31 – 09:00 – Jackson Hole Central Bank Symposium
Tue – Sep 11 – 09:00 – Troika to Greece
Charts of Interest: Tuesday and Thursday
This commentary and charts-of-interest are designed to stimulate thinking. This analysis is not a recommendation to buy, sell, hold or sell short any security (stock ETF or otherwise). We all need to think for ourselves when it comes to trading our own accounts. First, it is the only way to really learn. Second, we are the only ones responsible for our decisions. Think of these charts as food for further analysis. Before making a trade, it is important to have a plan. Plan the trade and trade the plan. Among other things, this includes setting a trigger level, a target area and a stop-loss level. It is also important to plan for three possible price movements: advance, decline or sideways. Have a plan for all three scenarios BEFORE making the trade. Consider possible holding times. And finally, look at overall market conditions and sector/industry performance.

