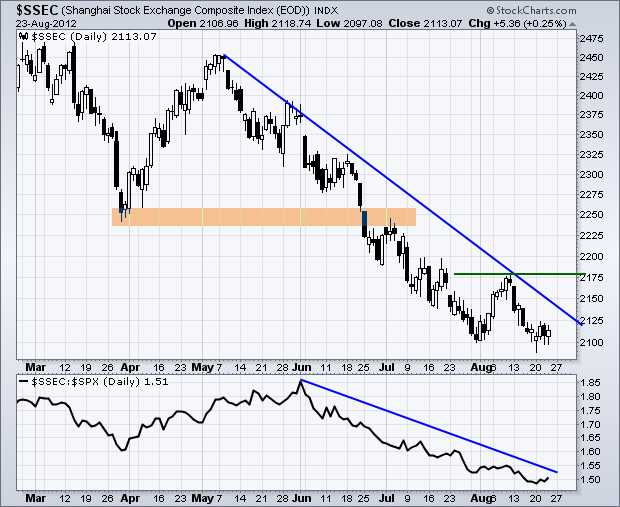
Stocks extended their correction with modest losses in the major index ETFs on Thursday. The Rydex S&P 500 Equal Weight ETF (RSP) led the way lower with a .91% loss. All sectors were down with the Basic Materials SPDR (XLB) and the Energy SPDR (XLE) pacing the losses. Both declined over 1%. Weakness in the Shanghai Composite ($SSEC) continues to weigh on industrial metals, which have not participated in the recent commodity rally. $SSEC moved below 2100 on Friday and continues to show relative weakness.

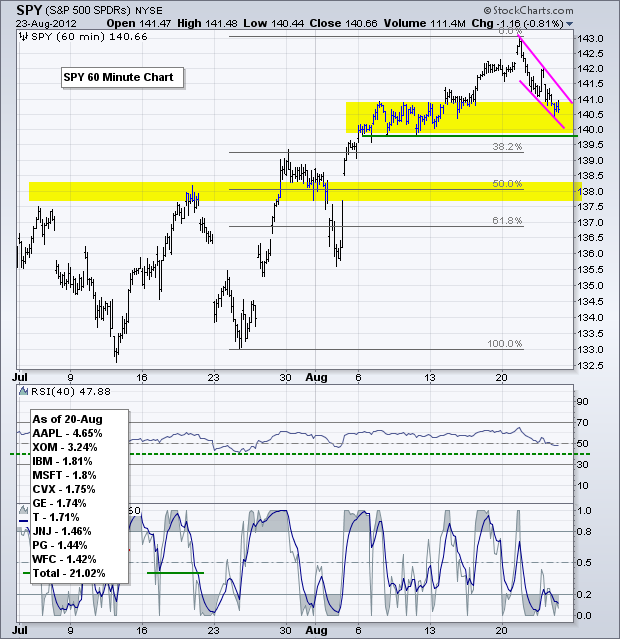
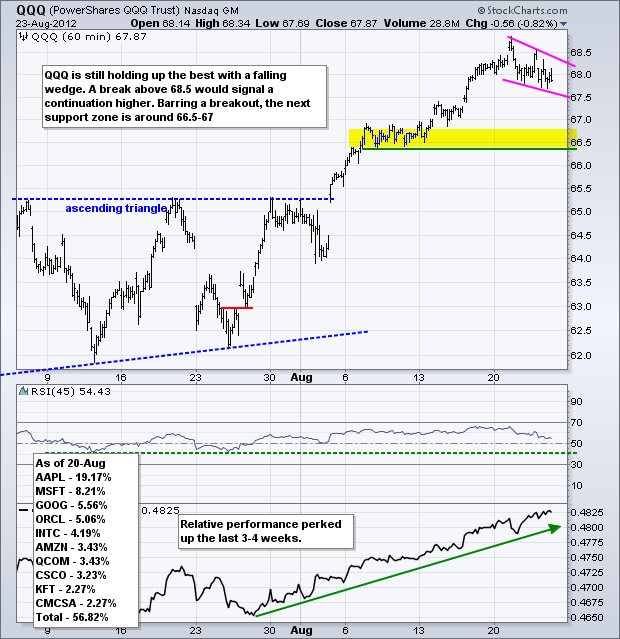
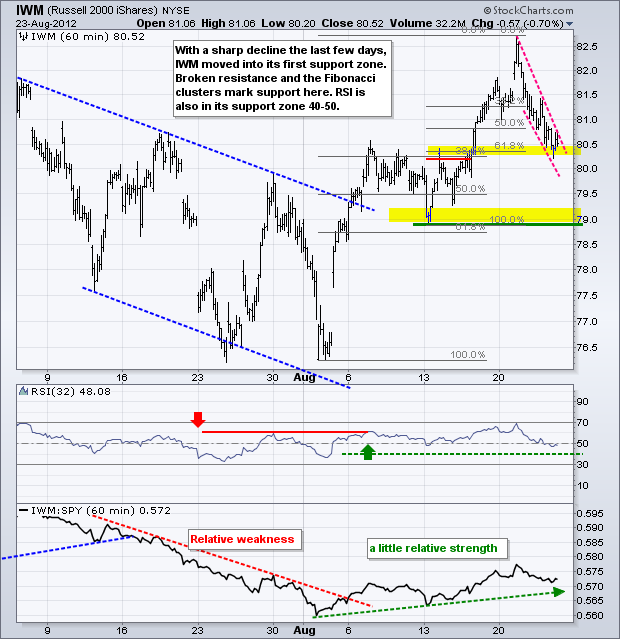
The S&P 500 ETF (SPY) extended its pull back with a decline into the support zone. Yes, I am still labeling this as a pullback or correction within a bigger uptrend. SPY hit a new 52-week high this week and the bigger trend is clearly up. The consolidation from the second week of August marks the first support zone to watch. A tight wedge formed as SPY declined into this support zone. With RSI moving into its support zone as well, we have the first moment-of-truth for SPY. There is still a little room to decline as the 140 area marks the bottom of the support zone and RSI could reach 40. Despite these support zones, I am concerned that this correction could extend further and return to broken resistance in the 138 area. This concern keeps me on the defensive short-term.
**************************************************************************
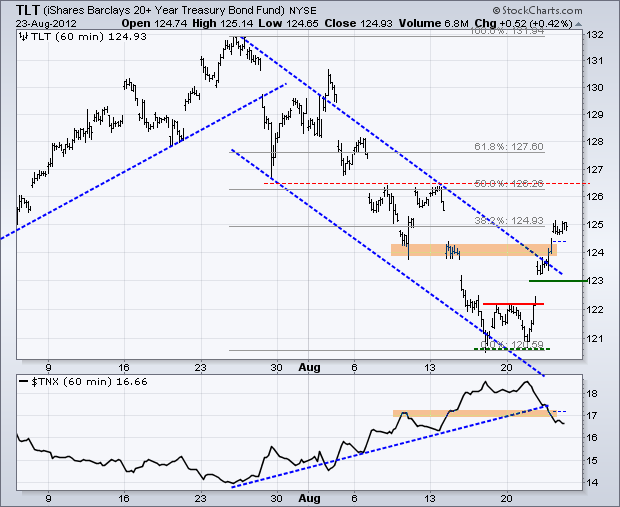
Treasuries continued higher as stocks moved lower. The seesaw relationship between these two remains in place. Money moved out of riskier assets and into relative safe havens the last 2-3 days. First resistance for TLT resides around 126.50, which marks the 50% retracement and the mid August highs.
**************************************************************************
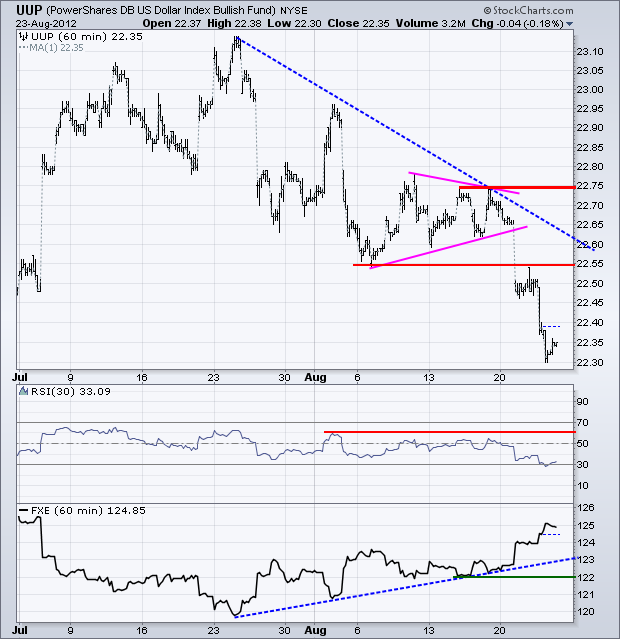
The US Dollar Fund (UUP) remained under pressure and broke below its June lows. Despite a lower low (technically), I still think there is a support zone in the 22.3-22.5 area extending back to broken resistance from the March high (daily chart). Nevertheless, the short-term trend for the greenback is down and has been since late July. UUP is getting very oversold as 30-period RSI on the 60-minute chart moved below 30 for the first time this year and 14-day RSI moved below 30 for the first time since February.
**************************************************************************
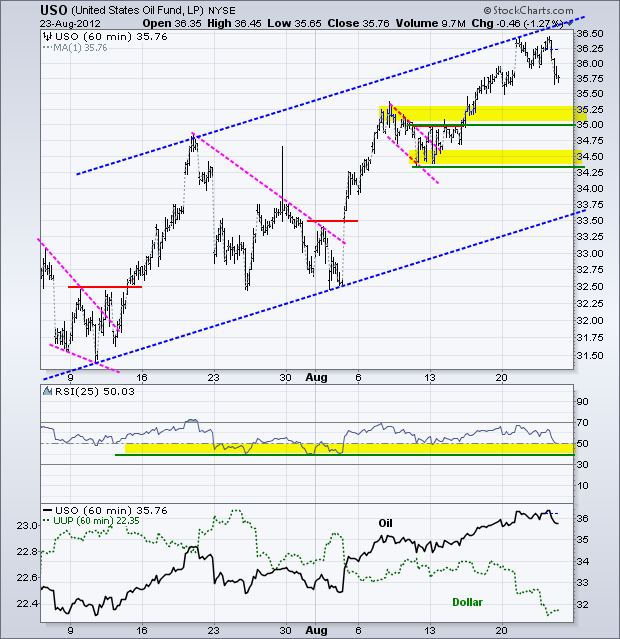
The US Oil Fund (USO) followed the stock market lower on Thursday with a modest decline. USO reached the upper trend line of the rising channel and became overbought on Tuesday. The flag breakout marks first support in the 35-35.5 area. RSI is nearing its support zone in the 40-50 zone.
**************************************************************************
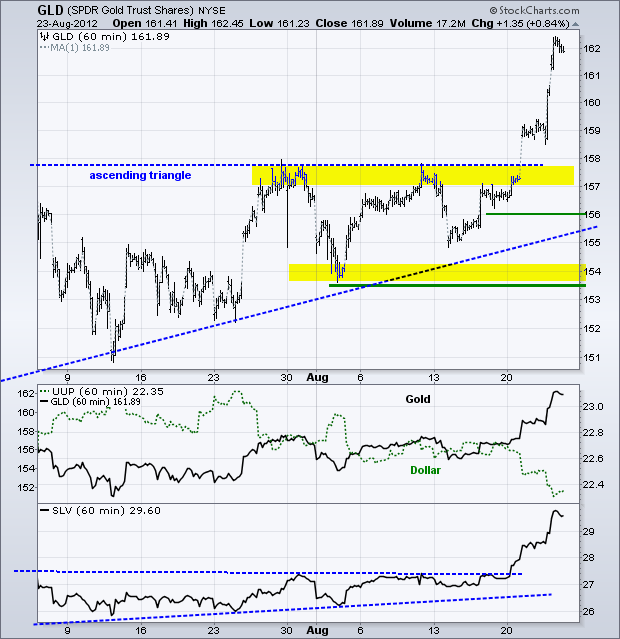
Gold continued higher on Thursday as weakness in the Dollar pushed money into this currency alternative. The Gold SPDR (GLD) is now up 4.5% since last week and getting short-term overbought. Broken resistance turns first support in the 158 area. The line-in-the-sand for this breakout remains at 156.
**************************************************************************
Key Reports and Events:
Fri - Aug 24 - 08:30 – Samaras & Merkel Meet in Berlin
Fri - Aug 24 - 08:30 - Durable Orders
Sat - Aug 25 - 08:30 – Samaras & Hollande Meet in Paris
Fri – Aug 31 – 09:00 – Jackson Hole Central Bank Symposium
Tue – Sep 11 – 09:00 – Troika to Greece
Wed – Sep 12 – 09:00 – German Constitutional Court Ruling
Charts of Interest: Tuesday and Thursday
This commentary and charts-of-interest are designed to stimulate thinking. This analysis is not a recommendation to buy, sell, hold or sell short any security (stock ETF or otherwise). We all need to think for ourselves when it comes to trading our own accounts. First, it is the only way to really learn. Second, we are the only ones responsible for our decisions. Think of these charts as food for further analysis. Before making a trade, it is important to have a plan. Plan the trade and trade the plan. Among other things, this includes setting a trigger level, a target area and a stop-loss level. It is also important to plan for three possible price movements: advance, decline or sideways. Have a plan for all three scenarios BEFORE making the trade. Consider possible holding times. And finally, look at overall market conditions and sector/industry performance.

About the author:
Arthur Hill, CMT, is the Chief Technical Strategist at TrendInvestorPro.com. Focusing predominantly on US equities and ETFs, his systematic approach of identifying trend, finding signals within the trend, and setting key price levels has made him an esteemed market technician. Arthur has written articles for numerous financial publications including Barrons and Stocks & Commodities Magazine. In addition to his Chartered Market Technician (CMT) designation, he holds an MBA from the Cass Business School at City University in London.
Learn More


