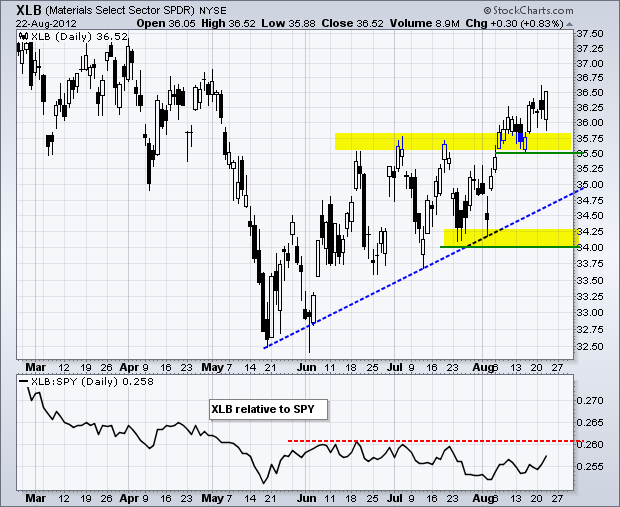
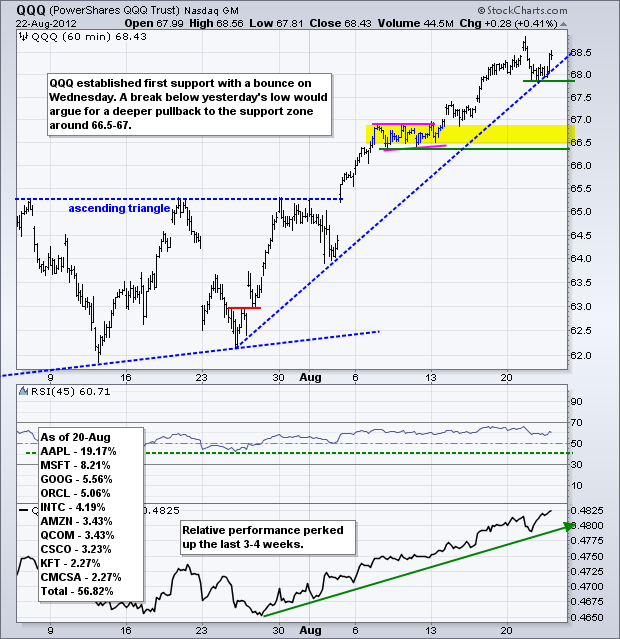
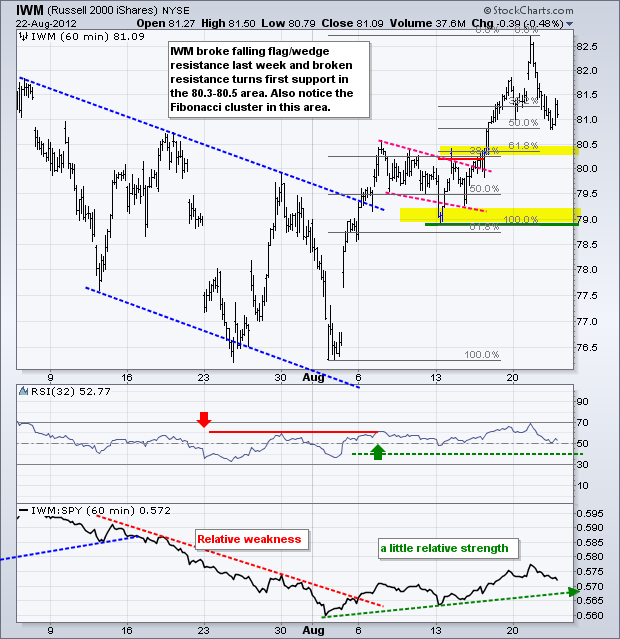
Stocks went on a wild ride Wednesday and finished the day mixed. Selling pressure dominated the morning, but hints of QE3 brought out the buyers in the afternoon. The Nasdaq 100 ETF (QQQ) led the advancers with a .41% gain, while the Russell 2000 ETF (IWM) led the decliners with a .48% loss. It does not get more mixed up than that. The sectors were also mixed with four up and five down. The Basic Materials SPDR (XLB) made a pretty strong recovery and closed with a .83% gain. XLB broke above resistance from the July highs in early August and this breakout is holding as long as the ETF remains above first support at 35.50.

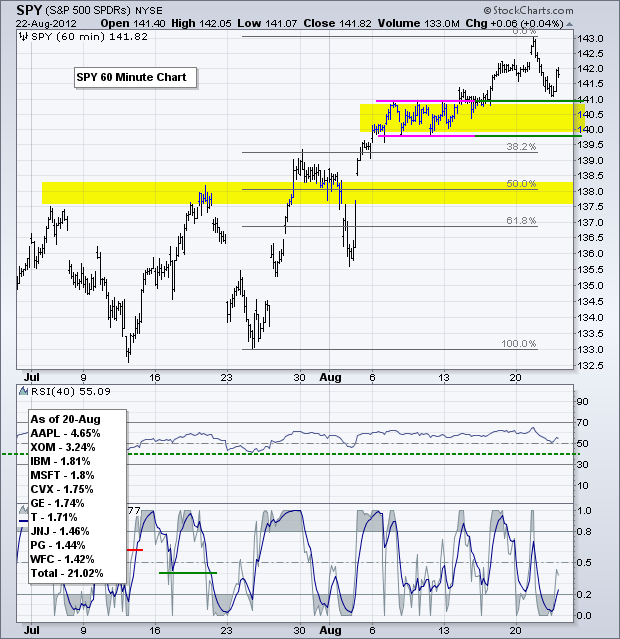
Stocks are currently in a holding pattern. The medium-term trends are up for the major index ETFs. The short-term trends are still up, but overbought and trading has turned choppy. Even though the chances of a pullback remain high, buying pressure is not letting up for long and pullbacks are very short. On the 60-minute chart, SPY declined to broken resistance and bounced off the 141 level in the afternoon. This bounce reinforces support here, but I am going to leave a support zone in the 140-141 area. A break below this zone would argue for a deeper correction that could extend to the 138 area.
**************************************************************************
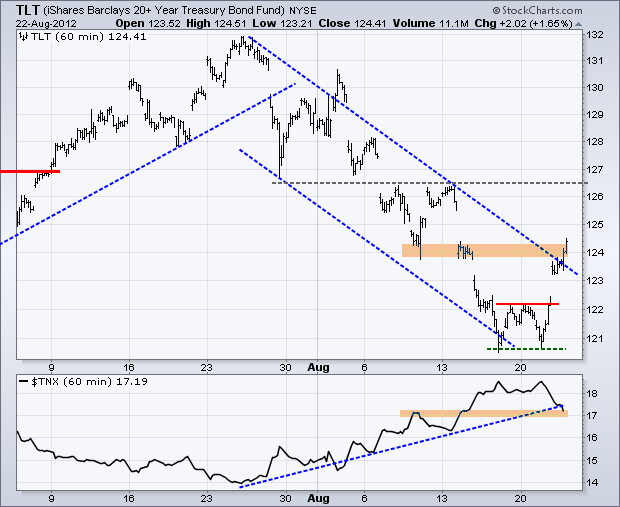
Treasuries moved higher after the Fed minutes suggested that QE3 was just around the corner. The 20+ Year T-Bond ETF (TLT) broke first resistance with a surge on Tuesday and continued higher on Wednesday. The break above 124 reverses the short-term downtrend and the next resistance level is set in the 126.5 area. The breakout in TLT is bearish for stocks because this favors the risk-off trade.
**************************************************************************
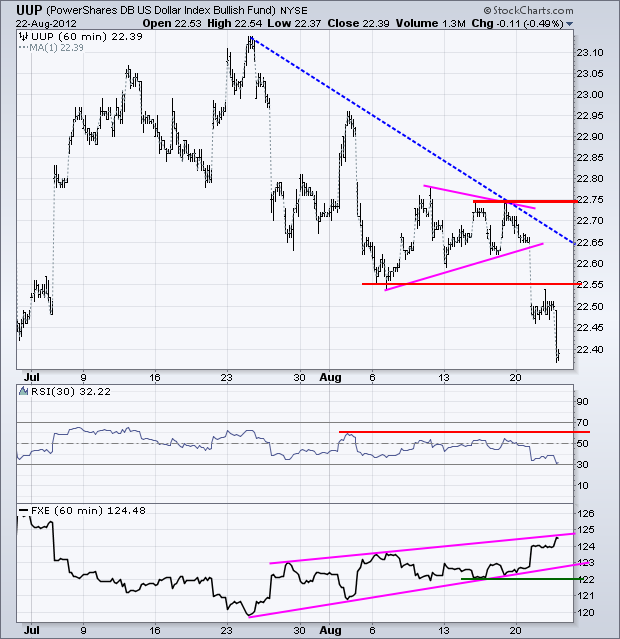
The Dollar is not keen on another round of quantitative easing because this would just dilute the greenback even further. As such, the US Dollar Fund (UUP) plunged after the Fed minutes were released and broken support turns first resistance in the 22.55 area. Key resistance remains at 22.75 and RSI resistance at 60.
**************************************************************************
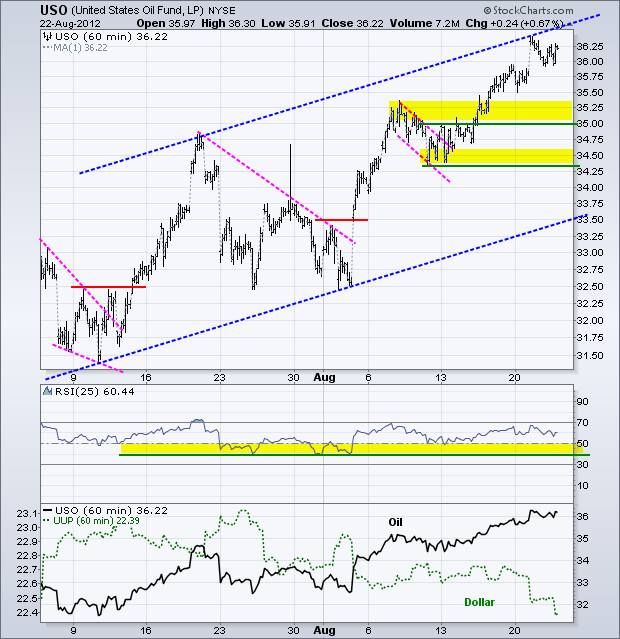
Oil and commodities are thrilled with a weaker Dollar and more quantitative easing. The US Oil Fund (USO) is holding near the upper trend line of a rising channel. Oil may be overbought, but there are no signs of selling pressure or weakness. Broken resistance turns first support in the 35-35.25 area. RSI support remains in the 40-50 zone.
**************************************************************************
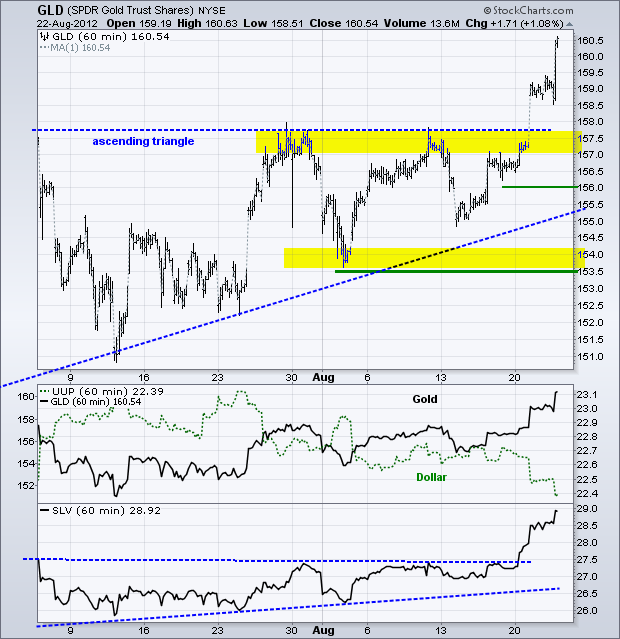
Gold, silver and precious metals moved sharply higher as the Dollar moved sharply lower. The Gold SPDR (GLD) broke ascending triangle resistance with a surge on Tuesday and extended its gains on Wednesday. Broken resistance turns first support in the 157-157.5 area. My line in the sand remains at 156. A move below this level would signal a breakout failure.
**************************************************************************
Key Reports and Events:
Thu - Aug 23 - 08:30 – Hollande & Merkel Meet in Berlin
Thu - Aug 23 - 08:30 - Initial Claims
Thu - Aug 23 - 10:00 - New Home Sales
Fri - Aug 24 - 08:30 – Samaras & Merkel Meet in Berlin
Fri - Aug 24 - 08:30 - Durable Orders
Sat - Aug 25 - 08:30 – Samaras & Hollande Meet in Paris
Fri – Aug 31 – 09:00 – Jackson Hole Central Bank Symposium
Tue – Sep 11 – 09:00 – Troika to Greece
Wed – Sep 12 – 09:00 – German Constitutional Court Ruling
Charts of Interest: Tuesday and Thursday
This commentary and charts-of-interest are designed to stimulate thinking. This analysis is not a recommendation to buy, sell, hold or sell short any security (stock ETF or otherwise). We all need to think for ourselves when it comes to trading our own accounts. First, it is the only way to really learn. Second, we are the only ones responsible for our decisions. Think of these charts as food for further analysis. Before making a trade, it is important to have a plan. Plan the trade and trade the plan. Among other things, this includes setting a trigger level, a target area and a stop-loss level. It is also important to plan for three possible price movements: advance, decline or sideways. Have a plan for all three scenarios BEFORE making the trade. Consider possible holding times. And finally, look at overall market conditions and sector/industry performance.

About the author:
Arthur Hill, CMT, is the Chief Technical Strategist at TrendInvestorPro.com. Focusing predominantly on US equities and ETFs, his systematic approach of identifying trend, finding signals within the trend, and setting key price levels has made him an esteemed market technician. Arthur has written articles for numerous financial publications including Barrons and Stocks & Commodities Magazine. In addition to his Chartered Market Technician (CMT) designation, he holds an MBA from the Cass Business School at City University in London.
Learn More


