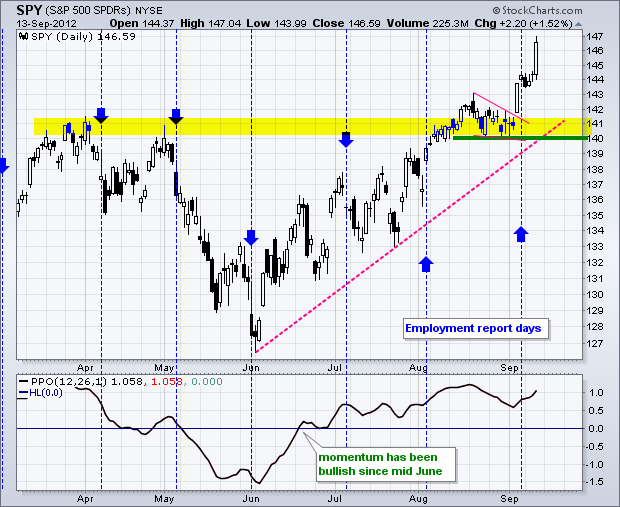
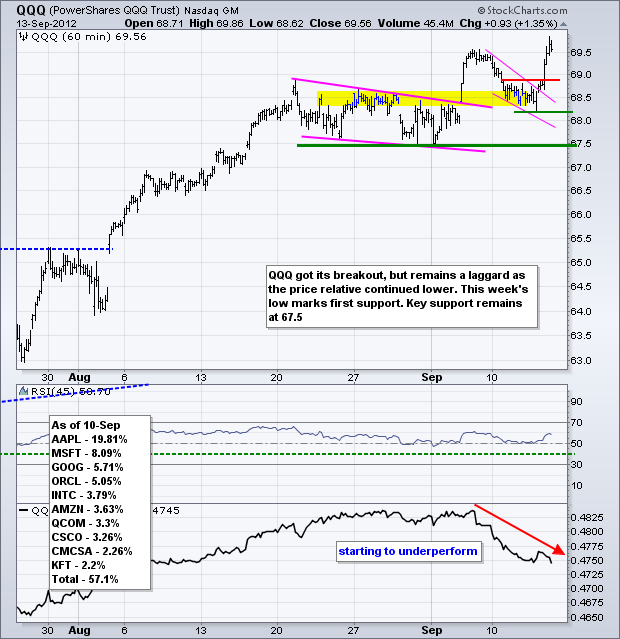
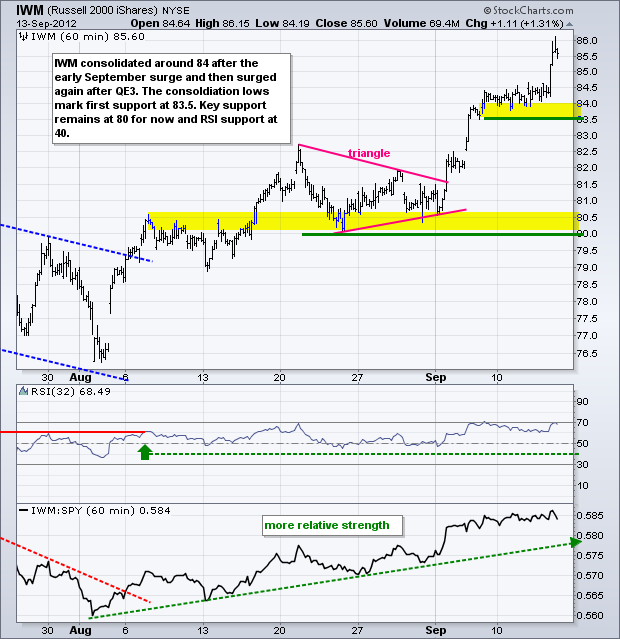
Judging from the reaction, it appears that the stock market is quite happy with a third round of quantitative easing. The major index ETFs surged with the S&P 500 ETF (SPY) and Dow Industrials SPDR (DIA) gaining around 1.5%. All sectors were up with the Finance SPDR (XLF) and Basic Materials SPDR (XLB) surging around 2.5%. The remaining sector SPDRs gained over 1%. Today's reaction was perhaps a bit muted because the stock market is up substantially since early June. SPY is up around 13.6% from its early June low. That is a very sharp advance in a little over three months. Also note that SPY is up over 4% in six trading days. Overbought is not necessarily bearish, but it can foreshadow a period of choppy trading or even a pullback.

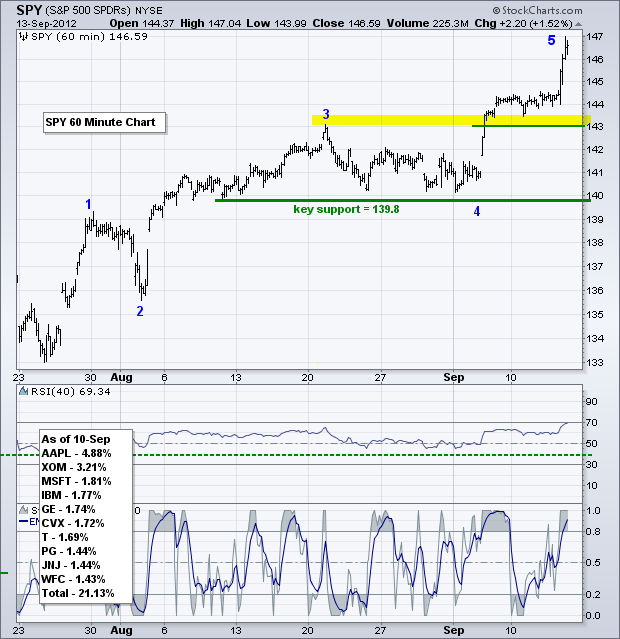
On the 60-minute chart, SPY broke above the mid August high around 143, consolidated and then surged above 146 after the QE3 announcement. Broken resistance and the consolidation lows turn first support at 143. Key support remains at 139.8 for now and RSI support at 40. A five wave advance is possible as long as Wave 3 is not the shortest of the three impulse waves. It is longer than Wave 1. Should this count be valid, Elliott Wave traders would expect a correction to begin soon.
**************************************************************************
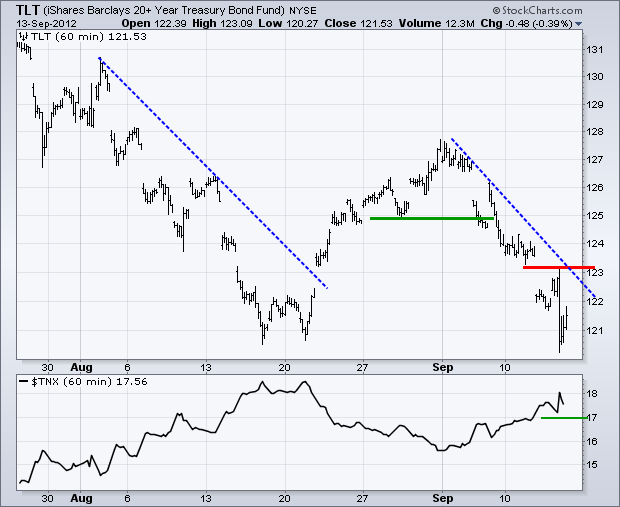
Trading was quite volatile in the 20+ Year T-Bond ETF (TLT) as the ETF surged above 123, fell below 121 and ended at 121.53. The trend since early September is clearly down with Thursday's high marking key resistance at 123.10. The 10-year Treasury Yield ($TNX) has key support at 17 (1.7%).
**************************************************************************
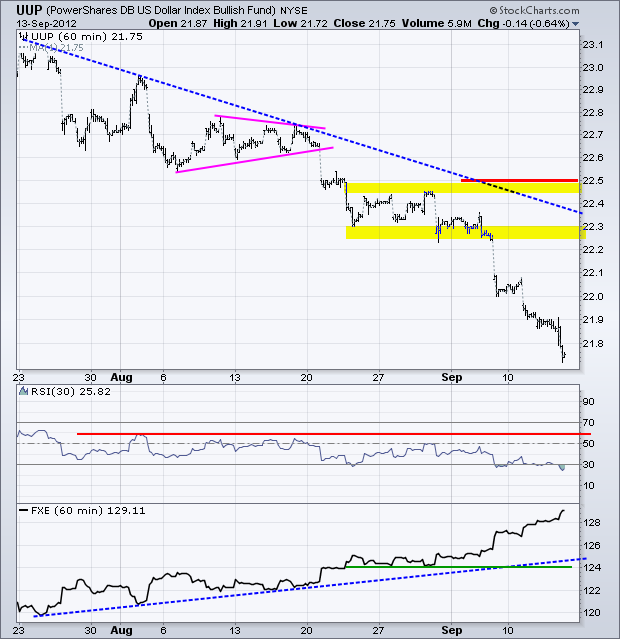
QE3 means more Dollars floating around and this dilutes the value of the greenback. As a result, the US Dollar Fund (UUP) plunged even further into oversold territory with a move below 21.8 on Thursday. The downtrend accelerated in September and UUP broke below its early May low. Broken support turns first resistance around 22.3 and key resistance remains at 22.50 for now.
**************************************************************************
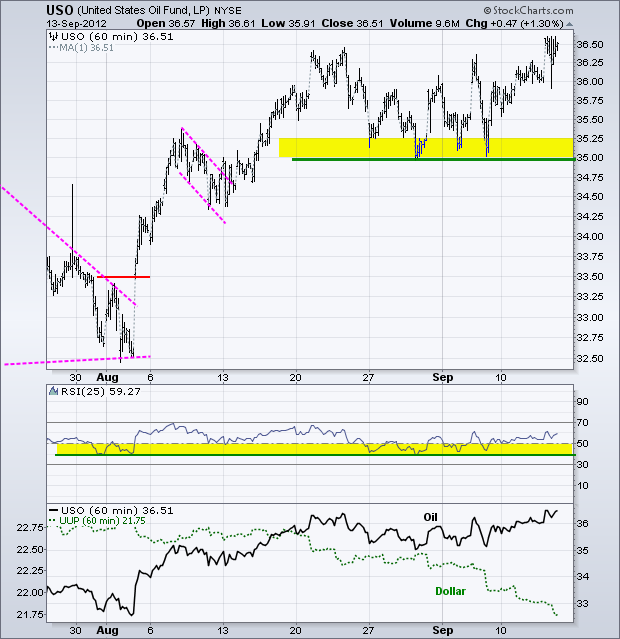
Oil surged as well and edged above its mid August high. Nevertheless, oil has been a laggard the last four weeks as it trades within a consolidation. Even though stocks are up and the Dollar is down, the US Oil Fund (USO) has been stuck between 35 and 36.6 since 20 August. Despite concerns with this underperformance, USO remains in an uptrend with support at 35 and RSI support at 40.
**************************************************************************
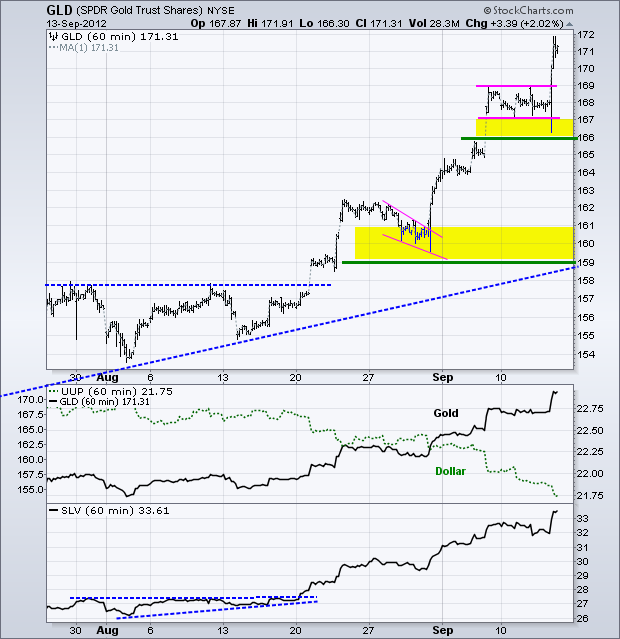
The Gold SPDR (GLD) broke consolidation resistance with a surge above 169. With this move, the ETF is up over 10% since early August and up almost 7% since late August. Gold is as overbought as the Dollar is oversold, but the trend is firmly entrenched. First support is set at 166 and key support is now set at 159.
**************************************************************************
Key Reports and Events:
Fri - Sep 14 - 08:30 - Retail Sales
Fri - Sep 14 - 08:30 – Consumer Price Index (CPI)
Fri - Sep 14 - 09:15 - Industrial Production
Fri - Sep 14 - 09:55 - Michigan Sentiment
Sat – Oct 06 – 09:00 – EU Summit
Charts of Interest: Tuesday and Thursday
This commentary and charts-of-interest are designed to stimulate thinking. This analysis is not a recommendation to buy, sell, hold or sell short any security (stock ETF or otherwise). We all need to think for ourselves when it comes to trading our own accounts. First, it is the only way to really learn. Second, we are the only ones responsible for our decisions. Think of these charts as food for further analysis. Before making a trade, it is important to have a plan. Plan the trade and trade the plan. Among other things, this includes setting a trigger level, a target area and a stop-loss level. It is also important to plan for three possible price movements: advance, decline or sideways. Have a plan for all three scenarios BEFORE making the trade. Consider possible holding times. And finally, look at overall market conditions and sector/industry performance.

About the author:
Arthur Hill, CMT, is the Chief Technical Strategist at TrendInvestorPro.com. Focusing predominantly on US equities and ETFs, his systematic approach of identifying trend, finding signals within the trend, and setting key price levels has made him an esteemed market technician. Arthur has written articles for numerous financial publications including Barrons and Stocks & Commodities Magazine. In addition to his Chartered Market Technician (CMT) designation, he holds an MBA from the Cass Business School at City University in London.
Learn More


