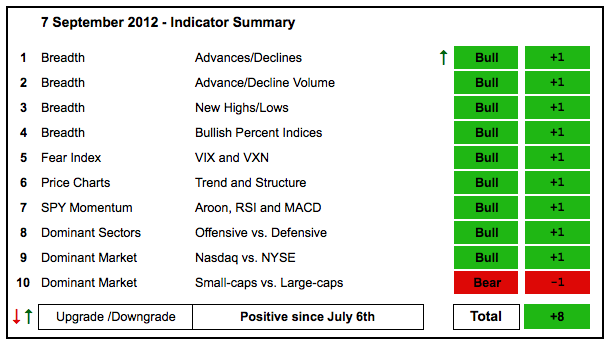
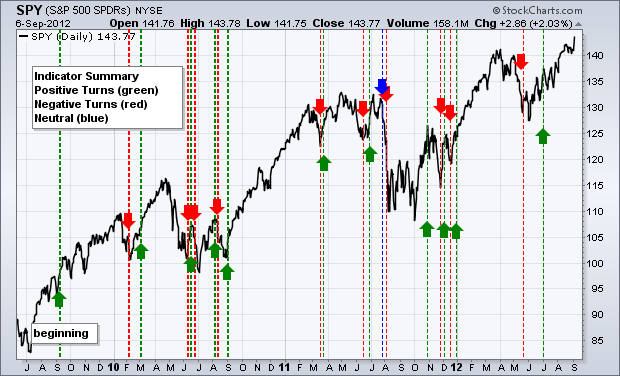
With a big surge on Thursday, stocks broke out of their funk and the indicator summary improved a notch. Techs continue to lead the market overall. The Nasdaq AD Line broke triangle resistance, Nasdaq Net New Highs surged to their highest levels since early July and the Technology SPDR (XLK) hit a new 52-week high. Throw in a new high in the NYSE AD Line and a 52-week high in NYSE Net New Highs and the bulk of the evidence remains firmly bullish.
This table is designed to offer an objective look at current market conditions. It does not aim to pick tops or bottoms. Instead, it seeks to identify noticeable shifts in buying and selling pressure. With 10 indicator groups, the medium-term evidence is unlikely to change drastically overnight.
Previous turns include:
Positive on 6-July-12
Negative on 18-May-12
Positive on 30-December-11
Negative on 16-December-11
Positive on 3-December-11
Negative on 23-November-11
Positive on 28-October-11
Negative on 5-August-11
Neutral on 29-Jul-11
Positive on 30-Jun-11
Negative on 17-Jun-11
Positive on 25-Mar-11
Negative on 18-Mar-11
Positive on 3-Sep-10
Negative on 13-Aug-10
Positive on 6-Aug-10
Negative on 24-Jun-10
Positive on 18-Jun-10
Negative on 11-Jun-10
Positive on 5-March-10
Negative on 5-Feb-10
Positive on 11-Sept-09


