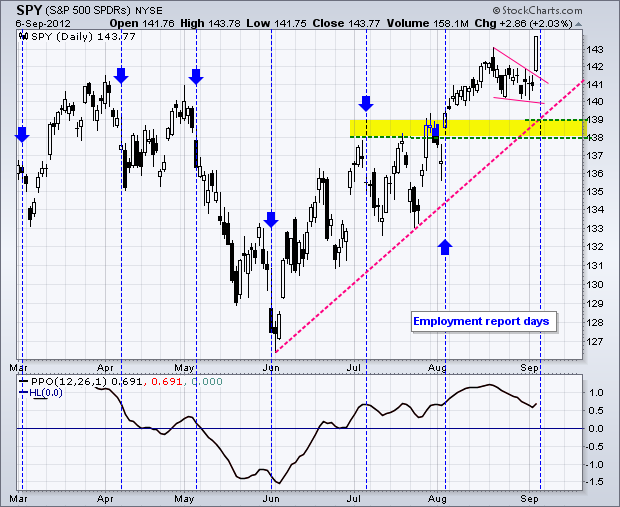
A mixed up Wall Street turned into a raving bull as stocks surged ahead of today's employment report. Rumor has it that Super Mario, Draghi, not Gabelli, inspired the bulls. It kind of makes the employment report an after thought. Consensus calls for non-farm payrolls to add 125,000 jobs. Anything around 150,000 would be better-than-expected and quite positive for stocks. This in turn would be negative for bonds. Anything south of 100,000 would be a big disappointment and be bullish for bonds, which in turn would be bearish for stocks. All we can do is wait and see right now. The chart below shows the S&P 500 ETF (SPY) breaking wedge resistance with a gap and long white candlestick. The ETF recorded a 52-week high and the breakout is clearly bullish until proven otherwise. The late August low marks first support at 140. A strong breakout should hold and a move back below 140 would be quite negative.

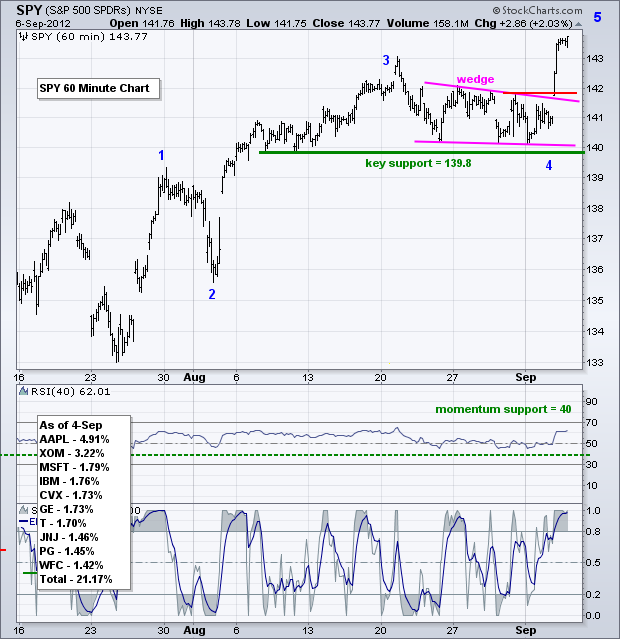
The 60-minute chart for SPY confirms what we saw on the daily chart. A five wave sequence could be unfolding with this breakout marking the start of the fifth wave. Even though such a count suggests a correction soon, I am more interested in the wedge breakout and overall uptrend. Broken resistance turns first support in the 142 area. A move below 141.8 would throw cold water on the breakout. A move below 139.8 would totally negate it and put the bears in control of the short-term trend.
**************************************************************************
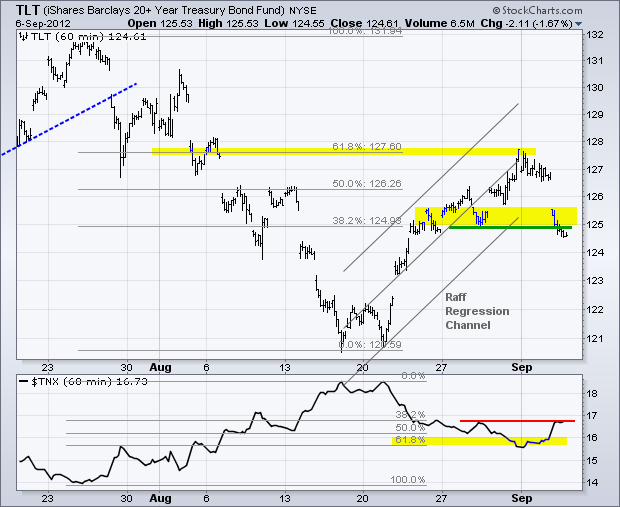
The market clearly moved to risk-on mode on Thursday as the 20+ Year T-Bond ETF (TLT) broke support at 125 with a sharp decline. Super Mario will support European sovereign debt and this takes the weight off US treasuries, which are supported by our Fed. With the failure at the 61.80% retracement and support break, the short-term trend is down for TLT and this is positive for stocks. Let's see if it holds after non-farm payrolls.
**************************************************************************
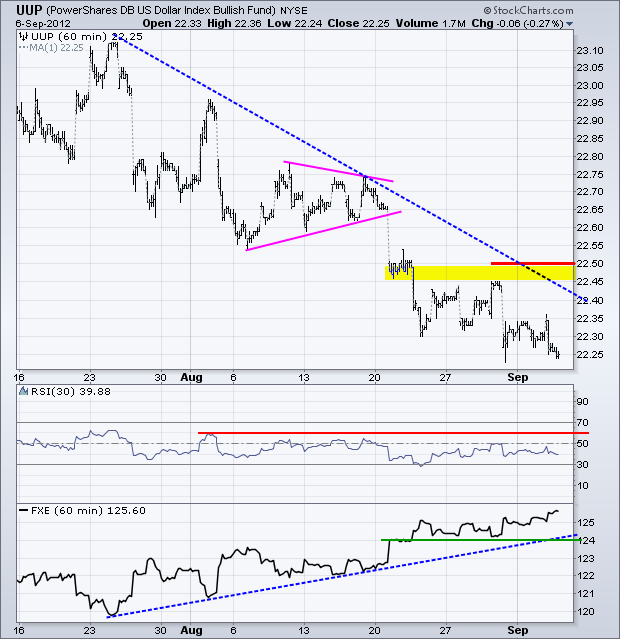
The Euro extended its advance on Thursday, but the move was not all that convincing. Perhaps we have a little buy-the-rumor and sell-the-news working here. The US Dollar Fund (UUP) edged lower and remains in a downtrend since late July. Key resistance is set at 22.50 and RSI resistance at 60.
**************************************************************************
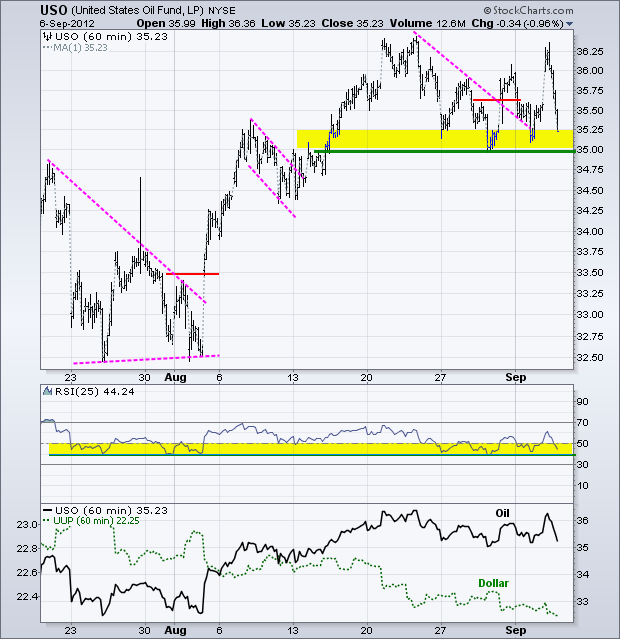
The US Oil Fund (USO) surged along with the stock market in early trading, but quickly gave up its gains and closed down on the day. Even though such price action is negative, USO remains near a support zone and has yet to actually break down. RSI is also in a support zone. This means the moment-of-truth is here. A break down in both would be bearish for USO.
**************************************************************************
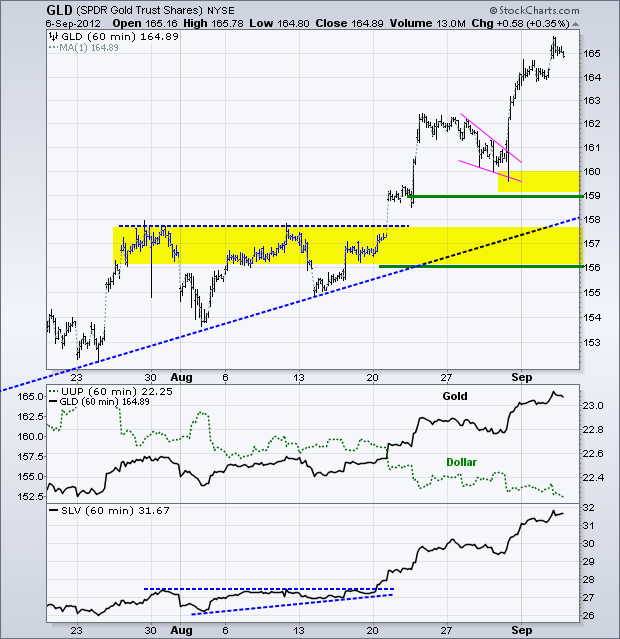
No change. The Gold SPDR (GLD) broke out in mid August, corrected last week and surged again the last four days. Last week's correction low marks first support. Broken resistance and the July trend line mark a support zone around 156-158. Keep an eye on the Dollar for clues on gold.
**************************************************************************
Key Reports and Events:
Fri - Sep 07 - 08:30 – Employment Report
Tue – Sep 11 – 09:00 – Troika to Greece
Wed – Sep 12 – 09:00 – German Ruling on European Stability Mechanism (ESM)
Wed – Sep 12 – 09:00 – EU Commission Banking Union Proposal
Wed – Sep 12 – 09:00 – Dutch Elections
Wed – Sep 12 – 14:15 – FOMC Policy Statement
Wed – Sep 12 – 09:00 – Apple Event for iPhone 5, iPad mini, iCar, iWife....
Sat – Oct 06 – 09:00 – EU Summit
Charts of Interest: Tuesday and Thursday
This commentary and charts-of-interest are designed to stimulate thinking. This analysis is not a recommendation to buy, sell, hold or sell short any security (stock ETF or otherwise). We all need to think for ourselves when it comes to trading our own accounts. First, it is the only way to really learn. Second, we are the only ones responsible for our decisions. Think of these charts as food for further analysis. Before making a trade, it is important to have a plan. Plan the trade and trade the plan. Among other things, this includes setting a trigger level, a target area and a stop-loss level. It is also important to plan for three possible price movements: advance, decline or sideways. Have a plan for all three scenarios BEFORE making the trade. Consider possible holding times. And finally, look at overall market conditions and sector/industry performance.

About the author:
Arthur Hill, CMT, is the Chief Technical Strategist at TrendInvestorPro.com. Focusing predominantly on US equities and ETFs, his systematic approach of identifying trend, finding signals within the trend, and setting key price levels has made him an esteemed market technician. Arthur has written articles for numerous financial publications including Barrons and Stocks & Commodities Magazine. In addition to his Chartered Market Technician (CMT) designation, he holds an MBA from the Cass Business School at City University in London.
Learn More


