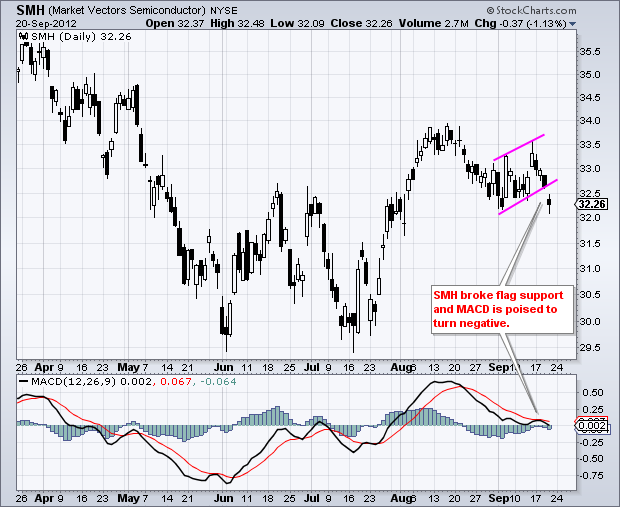
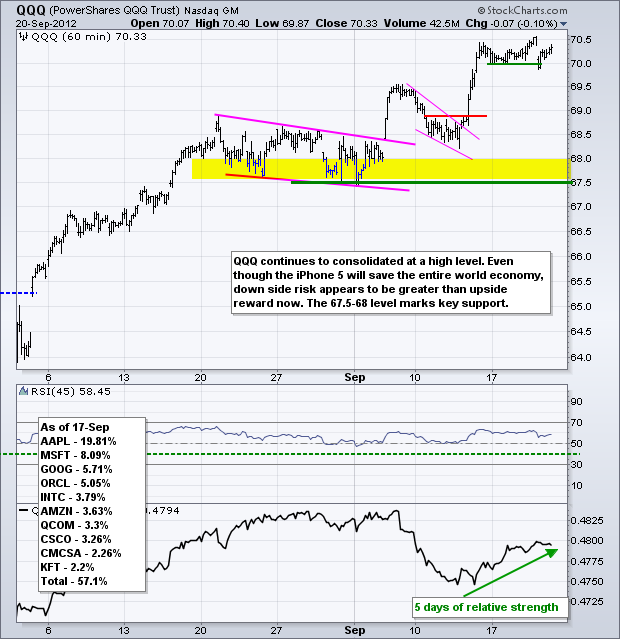
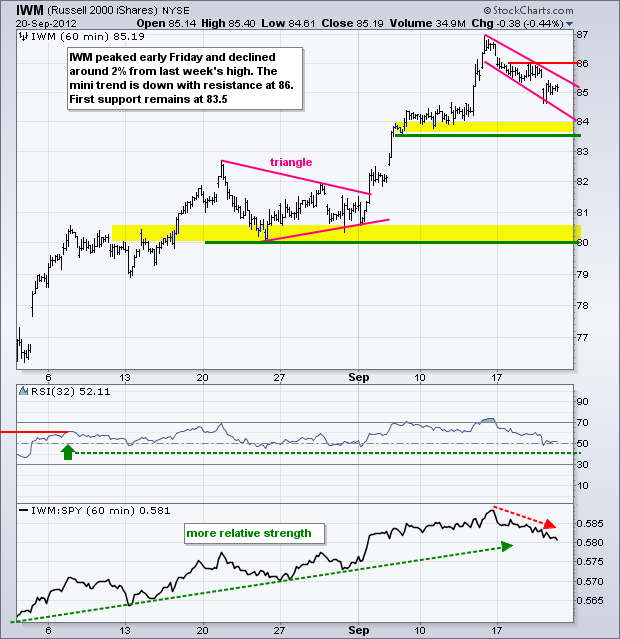
Thursday marked the fourth uneventful day this week as stocks finished mixed yet again. The Dow Industrials SPDR (DIA) and S&P 100 ETF (OEF) edged higher, but the Russell 2000 ETF (IWM) and S&P MidCap SPDR (MDY) closed modestly lower. In fact, we have definitely seen more selling pressure in small-caps and mid-caps this week than large-caps. SPY and DIA are relatively flat since Monday, but MDY and IWM are down, though modestly. The sectors were mixed on Thursday with four up and five down. There were some significant pockets of weakness within the Technology SPDR (XLK) as the Market Vectors Semiconductor ETF (SMH) and Networking iShares (IGN) both declined over 1%. Semis remain the weakest group within the technology sector.
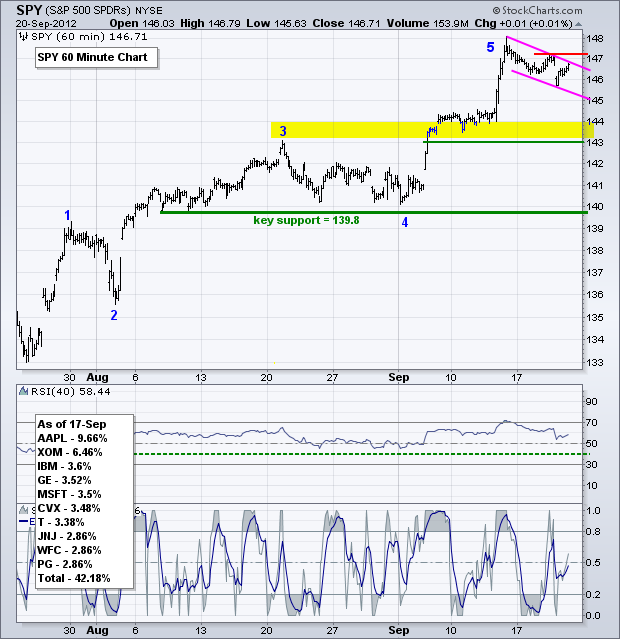
Even though SPY opened weak and rallied back to breakeven, the trend since early Friday remains down. A falling flag may be taking shape, but we need to see a break above Wednesday's high to reverse this mini downtrend. While a breakout would be bullish, I am concerned that SPY will simply pullback again and enter a bigger trading range over the next few weeks. This means we could be in for a choppy market without much of a short-term trend. Traders have been quite spoiled since early June as breakouts resulted in big moves and support levels held. Good trends don't last forever.
**************************************************************************
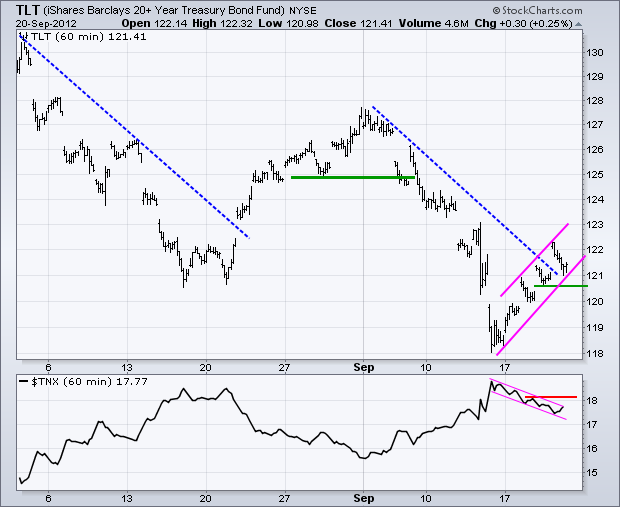
The 20+ Year T-Bond ETF (TLT) broke above the September trend line and remains in a 5 day uptrend. It ain't much, but even a mini uptrend in treasuries is negative for stocks. A rising flag or wedge may be unfolding with first support at 120.50. A break of support would be bearish for TLT and bullish for stocks.
**************************************************************************
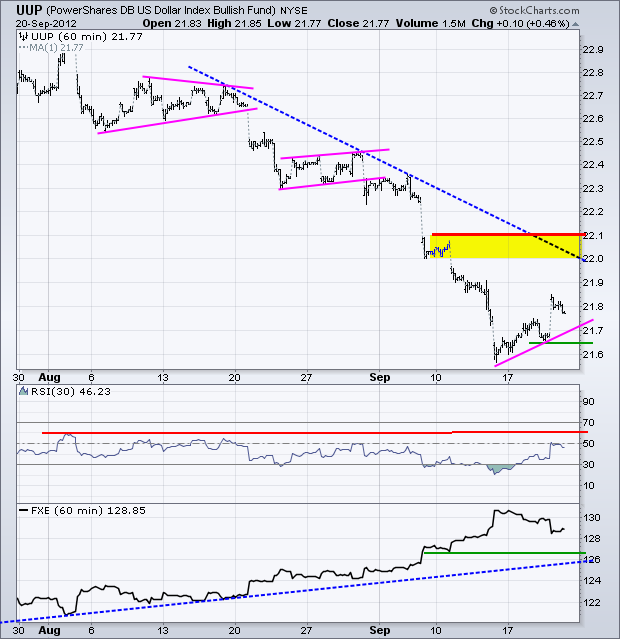
The US Dollar Fund (UUP) is following the 20+ Year T-Bond ETF (TLT) with a mini uptrend the last five days. An oversold bounce in the Dollar is negative for both stocks and commodities. Wednesday's low marks support for this mini uptrend. A break would signal a continuation of the bigger downtrend. The bigger trend remains down with resistance in the 22-22.1 area.
**************************************************************************
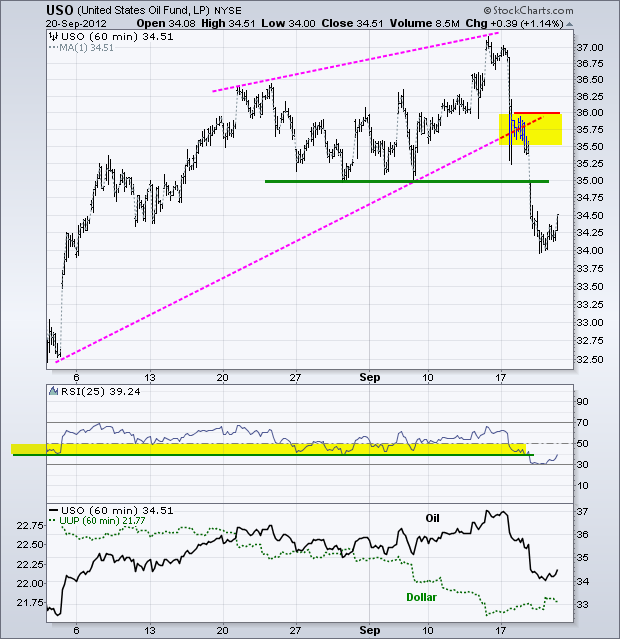
No change. The US Oil Fund (USO) completely broke down as the second shoe dropped on Wednesday. After falling sharply Monday afternoon, USO consolidated on Tuesday and broke support at 35 on Wednesday. This clearly reverses the uptrend that was in place since late June. Moreover, the June-Sept advance retraced 61.80% of the March-June decline. In other words, a bigger reversal could be in the making here. The broken trend line and Tuesday's high mark resistance at 36 for now.
**************************************************************************
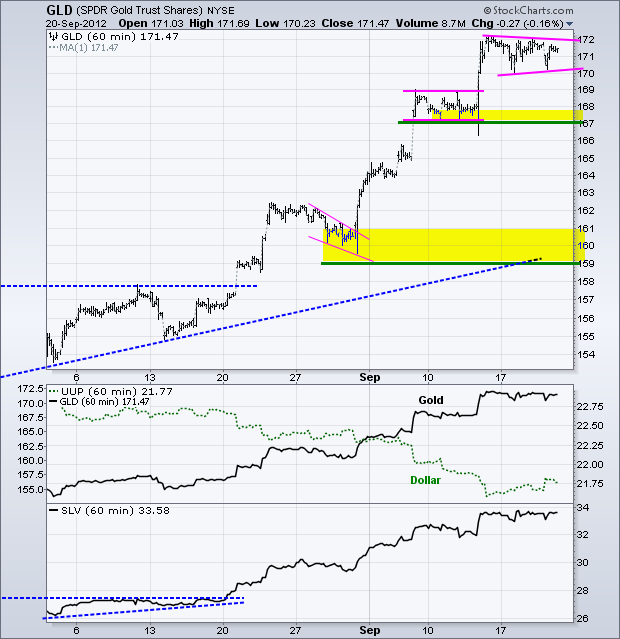
The Gold SPDR (GLD) formed a pennant over the last five days and held up relatively well. A break above pennant resistance would signal a continuation higher. Even though pennants are typically bullish continuation patterns, there are sometimes downside breaks and traders should watch support at 170 as well. A move below this level would open the door to a deeper pullback.
**************************************************************************
Key Reports and Events:
Fri - Sep 21 – 08:30 – Darden Restaurants and KB Home Earnings
Sat – Oct 06 – 09:00 – EU Summit
Charts of Interest: Tuesday and Thursday
This commentary and charts-of-interest are designed to stimulate thinking. This analysis is not a recommendation to buy, sell, hold or sell short any security (stock ETF or otherwise). We all need to think for ourselves when it comes to trading our own accounts. First, it is the only way to really learn. Second, we are the only ones responsible for our decisions. Think of these charts as food for further analysis. Before making a trade, it is important to have a plan. Plan the trade and trade the plan. Among other things, this includes setting a trigger level, a target area and a stop-loss level. It is also important to plan for three possible price movements: advance, decline or sideways. Have a plan for all three scenarios BEFORE making the trade. Consider possible holding times. And finally, look at overall market conditions and sector/industry performance.

