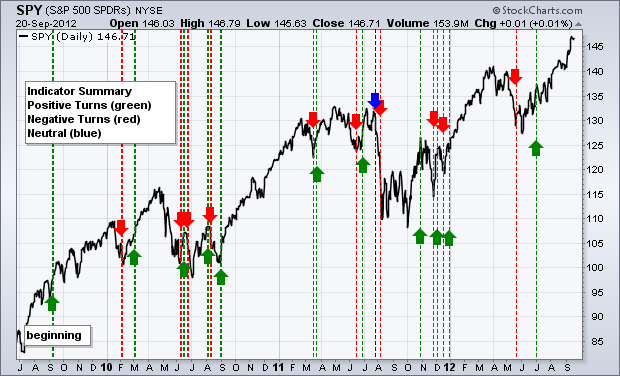
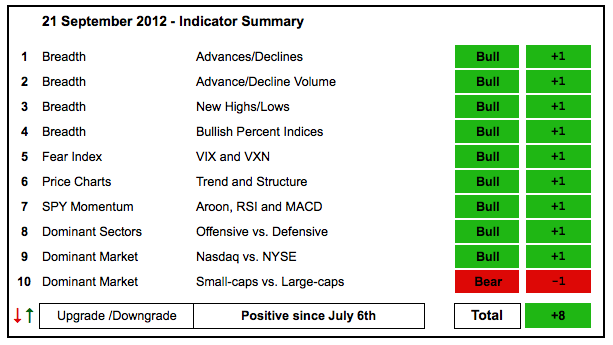
With new highs last week and flat trading this week, there is no change in the indicator summary. Even though the bulk of the evidence remains bullish, I am concerned with overbought conditions and some extremes starting to appear in the sentiment indicators. The $VIX moved below 15% and the $VXN moved to its lowest level since June 2007. These extremes indicate that we may see a corrective period in the stock market. I will detail these charts in today's Market Message.
- AD Lines: Bullish. The Nasdaq AD Line broke triangle resistance and exceeded its summer high. The NYSE AD Line hit a new 52-week high this month and remains in a strong uptrend.
- AD Volume Lines: Bullish. The Nasdaq exceeded its spring high, but the AD Volume Line remains well below this high with a large bearish divergence brewing. The trend, however, is up since early June. The NYSE AD Volume Line touched its spring highs this month and remains in a clear uptrend.
- Net New Highs: Bullish. Nasdaq Net New Highs surged last week and fell back this week, but they remain positive and bullish overall. NYSE Net New Highs have been positive since late June.
- Bullish Percent Indices: Bullish. All nine sector BPIs are above 70%. The Technology Bullish% Index ($BPINFO) is the "least strong" with a 70.89% reading.
- VIX/VXN: Bullish. The S&P 500 Volatility Index ($VIX) moved below 15% for the fourth time since January 2011. The prior occurrences marked intermediate peaks in the S&P 500. The Nasdaq 100 Volatility Index ($VXN) moved to its lowest level since June 2007!
- Trend-Structure: Bullish. DIA, IWM, MDY, QQQ and SPY recorded 52-week highs last week. The major index ETFs may be overbought, but they are definitely in uptrends.
- SPY Momentum: Bullish. The Aroon Oscillator (20) has been positive since mid June. MACD(5,35,5) has been positive since late June. RSI has been above 70 since last week.
- Offensive Sector Performance: Bullish. XLY and XLK recorded 52-week highs last week and continue to show upside leadership. XLF and XLI hit resistance from their spring highs.
- Nasdaq Performance: Bullish. The $COMPQ:$NYA ratio plunged this month, but remains in an uptrend since April.
- Small-cap Performance: Bearish. The $RUT:$OEX has been on a tear since early August, but has yet to reverse the downtrend that started in early February. This remains a tough call because small-caps have seriously outperformed the last six weeks.
- Breadth Charts (here) and Inter-market charts (here) have been updated.

Previous turns include:
Positive on 6-July-12
Negative on 18-May-12
Positive on 30-December-11
Negative on 16-December-11
Positive on 3-December-11
Negative on 23-November-11
Positive on 28-October-11
Negative on 5-August-11
Neutral on 29-Jul-11
Positive on 30-Jun-11
Negative on 17-Jun-11
Positive on 25-Mar-11
Negative on 18-Mar-11
Positive on 3-Sep-10
Negative on 13-Aug-10
Positive on 6-Aug-10
Negative on 24-Jun-10
Positive on 18-Jun-10
Negative on 11-Jun-10
Positive on 5-March-10
Negative on 5-Feb-10
Positive on 11-Sept-09

About the author:
Arthur Hill, CMT, is the Chief Technical Strategist at TrendInvestorPro.com. Focusing predominantly on US equities and ETFs, his systematic approach of identifying trend, finding signals within the trend, and setting key price levels has made him an esteemed market technician. Arthur has written articles for numerous financial publications including Barrons and Stocks & Commodities Magazine. In addition to his Chartered Market Technician (CMT) designation, he holds an MBA from the Cass Business School at City University in London.
Learn More


