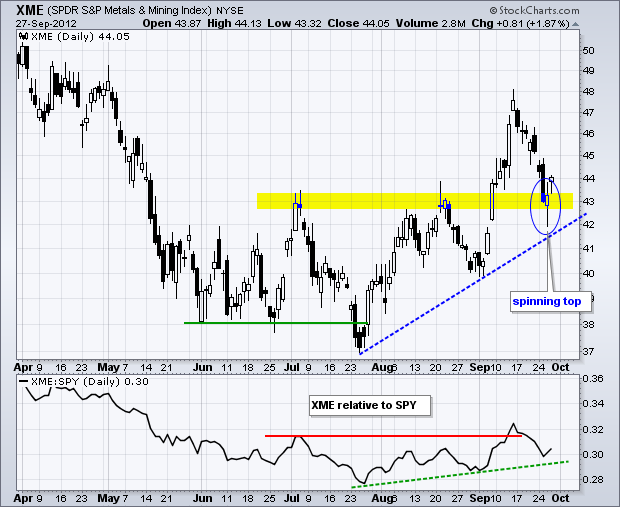
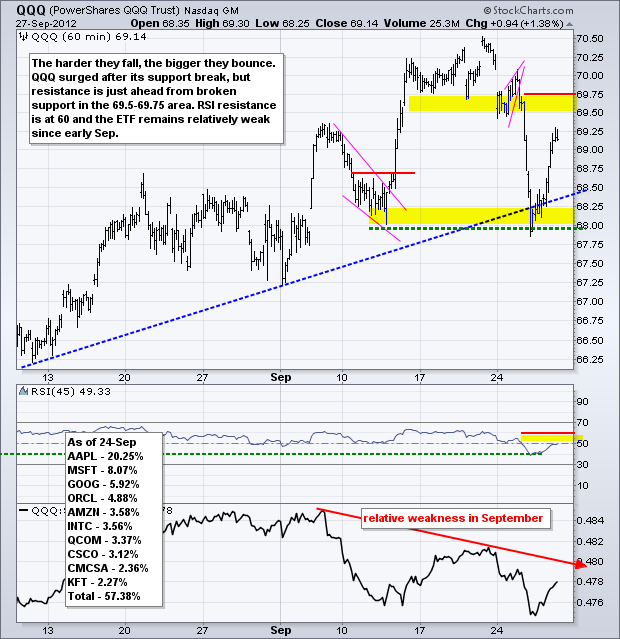
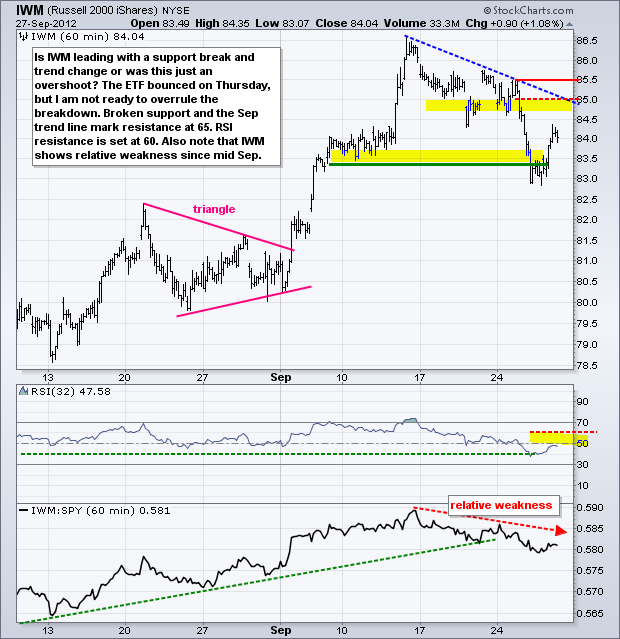
Stocks rebounded across the board with the hardest hit groups getting the biggest pops. The Nasdaq 100 ETF (QQQ) led the way with a 1.38% bounce. Eight of nine sectors were up with energy leading the way on the heels of a big oversold bounce in crude. The utilities sector was the only loser as money moved out of this defensive group. Once again, industry groups within the materials sector provided the biggest pops. These groups were hit the hardest in mid September. The Metals & Mining SPDR (XME) fell from 48 to 42 in nine days and then surged above 44 on Thursday. Broken resistance turned into support as a large spinning top formed. With this bounce, support at 42 now holds the key to the uptrend that started in late July.
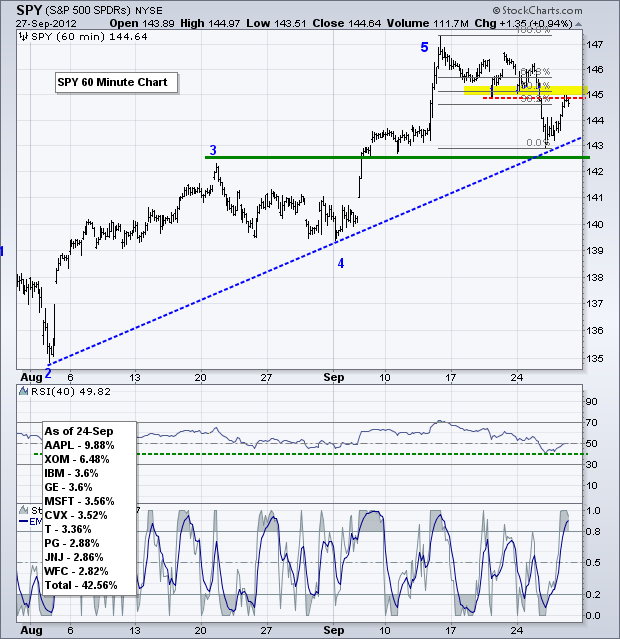
Right on cue, the S&P 500 ETF (SPY) bounced off the support zone in the 143 area and RSI bounced off 40 to keep the short-term uptrend alive. Key support is now marked at 142.5 and a break would clearly reverse the short-term uptrend. RSI support remains at 40. Shorter-term, SPY could run into resistance in the 145 area from broken support and the 50% retracement. If a downtrend is indeed starting, I would expect this bounce to fail in the 145-146 area.
**************************************************************************
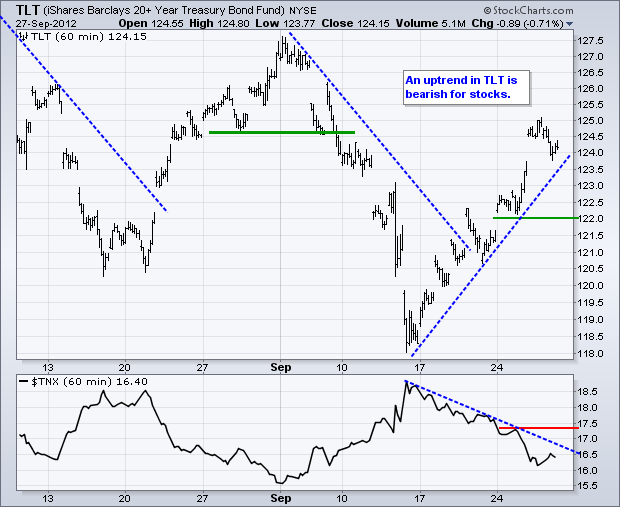
No change. The 20+ Year T-Bond ETF (TLT) flashed the warning sign last week with a fairly sharp advance back above 121. This uptrend continued this week as TLT surged above 123.50 on Tuesday and above 125 on Wednesday. Money moving into treasuries is money that is not available for stocks and other riskier assets. Moreover, the decline in treasury yields points to weakness in the economy (perhaps third quarter earnings). I am marking support at 122 for TLT.
**************************************************************************
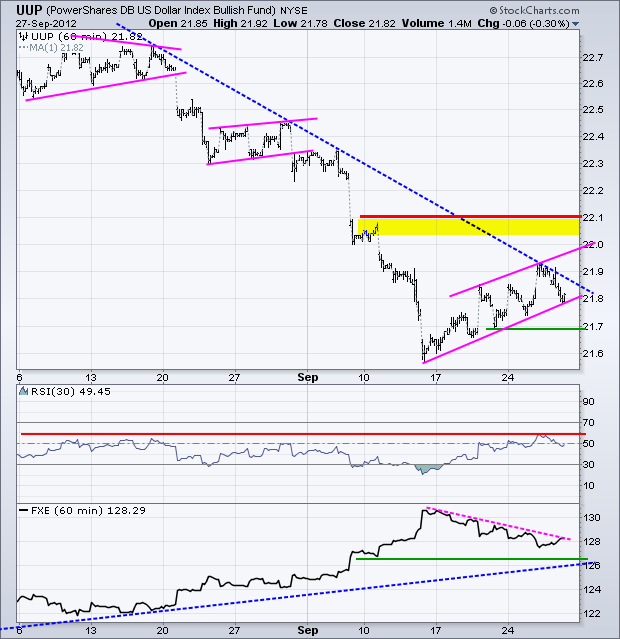
No change. The US Dollar Fund (UUP) has been positively correlated with US Treasuries. This makes sense because both rise when the risk trade is on and both fall when the risk trade is off. The risk trade has been off since mid September as UUP bottomed and bounced from oversold levels. The overall trend remains down with resistance marked in the 22.10 area. With the slow rise over the last two weeks, I can mark short-term support at 21.68, a break of which would signal a continuation of the downtrend.
**************************************************************************
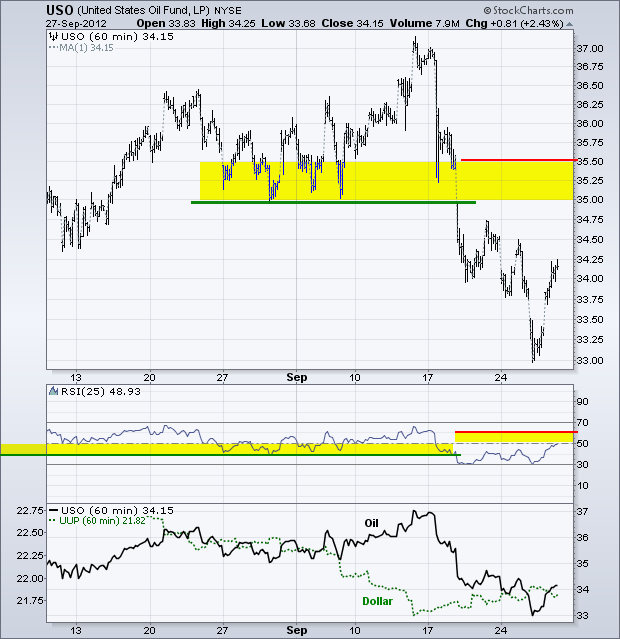
No change. The US Oil Fund (USO) broke down last week, bounced on Thursday-Friday and continued lower this week. An overall trend is clearly down, but oil is getting short-term oversold after an 8% decline in one week. Broken support turns into first resistance in the 35-35.5 area. RSI resistance is set in the 50-60 area.
**************************************************************************
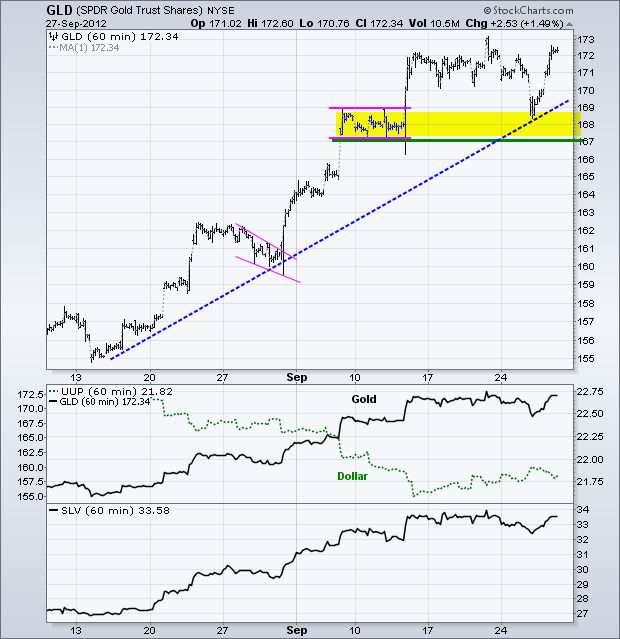
Yep, folks are piling into gold, silver, gold stocks and junior gold stocks. The relatively feeble bounce in the Dollars emboldened the bullion bulls as the Gold SPDR (GLD) surged back above 172. This move reinforces support in the 167-169 area. A break below this level would reverse this short-term uptrend.
**************************************************************************
Key Reports and Events:
Fri - Sep 28 - 08:30 - Personal Income & Spending
Fri - Sep 28 - 09:45 - Chicago PMI
Fri - Sep 28 - 09:55 - Michigan Sentiment
Sat – Oct 06 – 09:00 – EU Summit
Charts of Interest: Tuesday and Thursday
This commentary and charts-of-interest are designed to stimulate thinking. This analysis is not a recommendation to buy, sell, hold or sell short any security (stock ETF or otherwise). We all need to think for ourselves when it comes to trading our own accounts. First, it is the only way to really learn. Second, we are the only ones responsible for our decisions. Think of these charts as food for further analysis. Before making a trade, it is important to have a plan. Plan the trade and trade the plan. Among other things, this includes setting a trigger level, a target area and a stop-loss level. It is also important to plan for three possible price movements: advance, decline or sideways. Have a plan for all three scenarios BEFORE making the trade. Consider possible holding times. And finally, look at overall market conditions and sector/industry performance.

