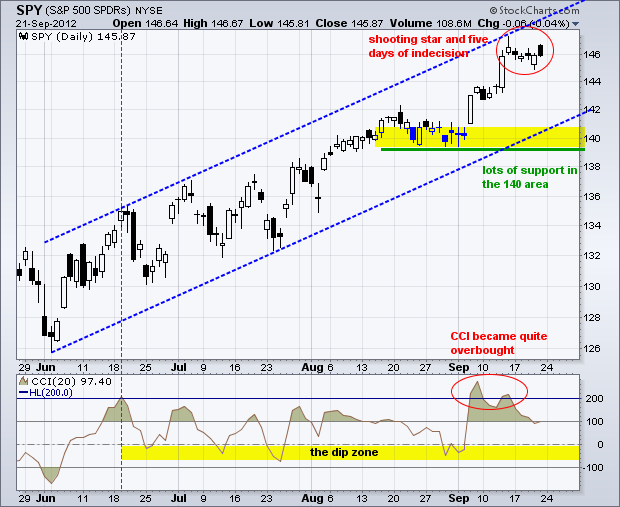
Last week was the week that was not. Stocks surged on Thursday, September 13th, and then stalled the next six days. This indecisive period started as SPY formed a shooting start on Friday, September 14th. The ETF formed small candlesticks on Monday, Tuesday and Wednesday. Thursday's open was weak, but SPY managed to rebound and closed unchanged for the day. Friday's open was strong, but SPY did not hold its gains and again closed unchanged for the day. SPY is currently engaged in the battle for 146. As the chart below shows SPY became quite overbought when CCI moved above 250 the first week of September and above 200 the second week. The trend since early June is clearly up, but SPY is trading near the top of a possible channel. This increases the chances for a pullback, perhaps to the lower trend line or to support in the 139-140 area.

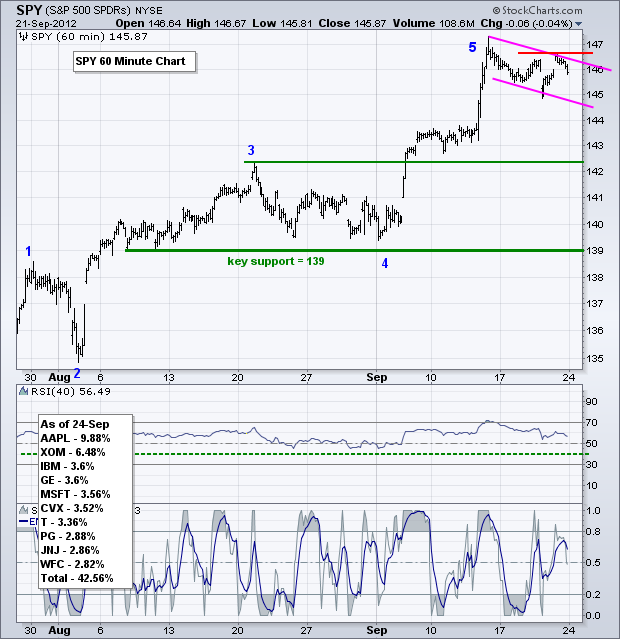
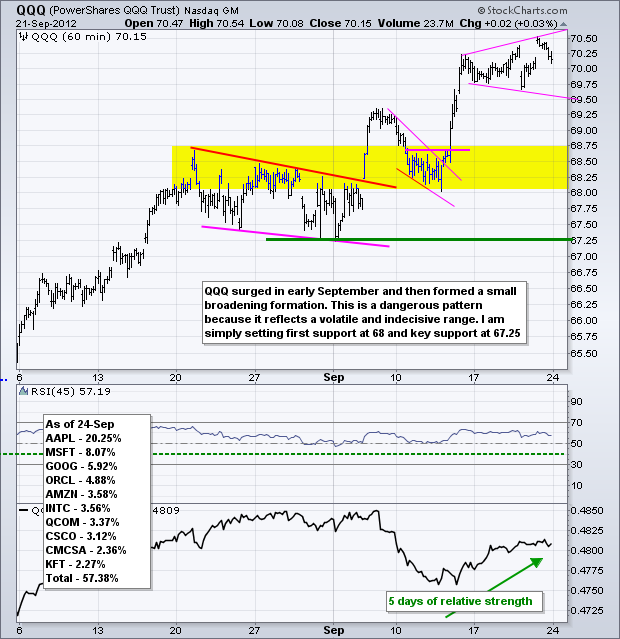
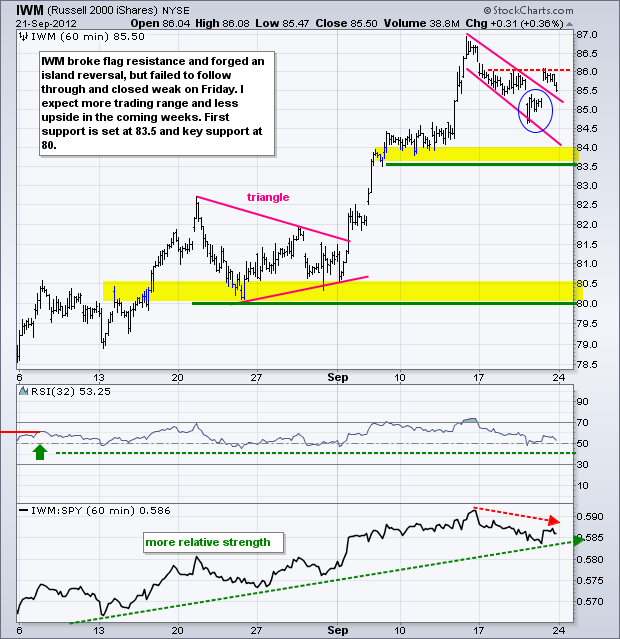
SPY opened above Wednesday's high, but fell back by the close and failed to follow through. The trend since early Friday (14-Sep) has been down with a falling flag of sorts taking shape. Even though this is a bullish pattern, I am skeptical that a breakout will produce a big gain. As noted before, I think overbought conditions are more likely to prevail and push the market into a corrective period. Correction can be with pullback or flat trading ranges (consolidations). Broken resistance and the early September consolidation mark first support around 143. Key support remains in the 139-140 area. These levels shifted over the weekend because SPY went ex-dividend on Friday. StockCharts.com adjusted the historical data to account for this dividend.
**************************************************************************
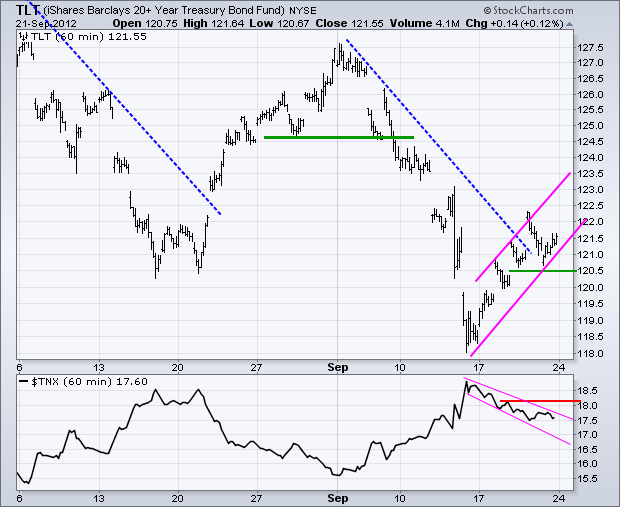
The 20+ Year T-Bond ETF (TLT) surged mid week and then fell back, but remains in an uptrend since the mid September low. The pink lines define this uptrend with support at 120.50. A short-term uptrend in treasuries is negative for stocks because these two are negatively correlated. A break below 120.5 would be negative for TLT and bullish for SPY.
**************************************************************************
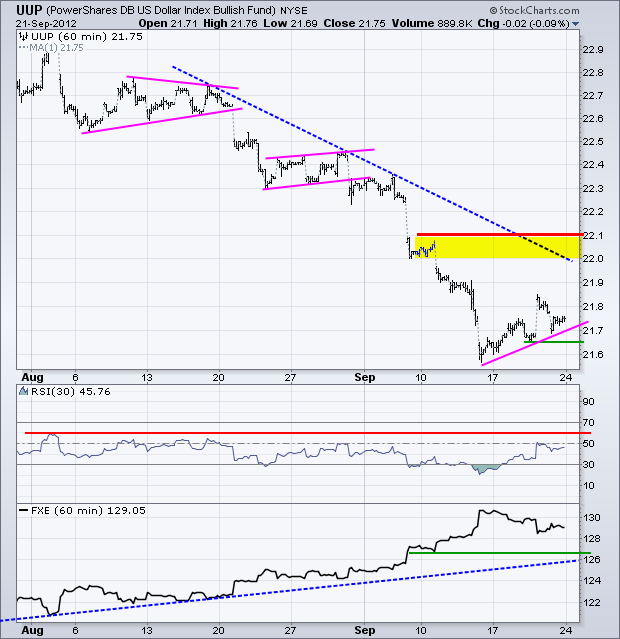
The US Dollar Fund (UUP) has been positively correlated with US Treasuries. This makes sense because both rise when the risk trade is on and both fall when the risk trade is off. The risk trade has been off since mid September as UUP bottomed and bounced from oversold levels. The overall trend remains down with resistance marked in the 2.10 area. With last week's rise, I can mark short-term support at 21.65, a break of which would signal a continuation of the downtrend.
**************************************************************************
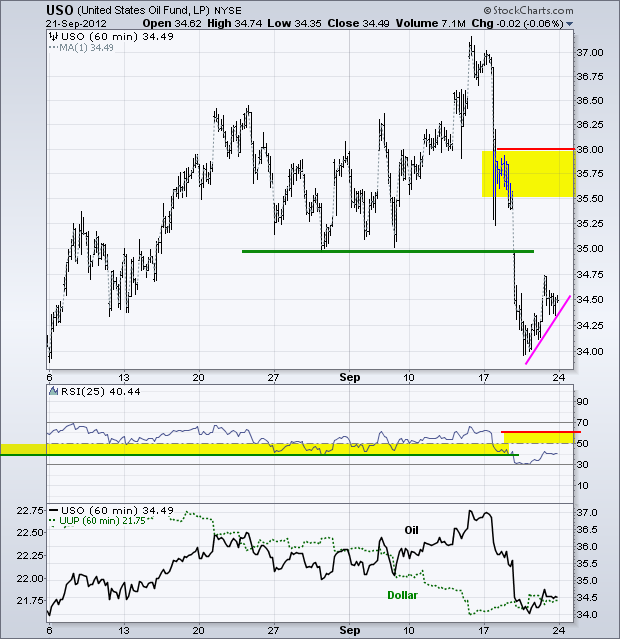
In contrast to stocks, last week was quite eventful for oil. Stocks stalled, the Dollar bounced and oil fell sharply. This reaction seems over the top. Or, perhaps, this reaction is a precursor for the stock market and the Dollar. On the price chart, USO broke support with a sharp move and the support break is holding. The trend is now down and I am marking resistance in the 35.5-36 area. RSI resistance is set at 60.
**************************************************************************
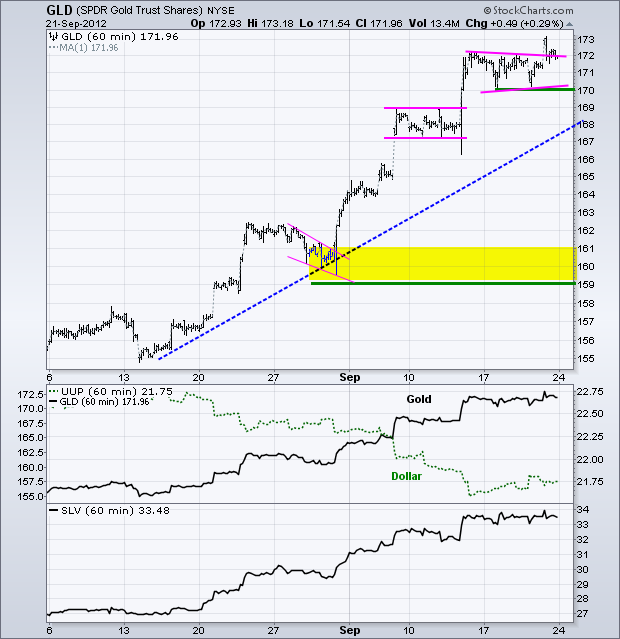
The bounce in treasuries and decline in oil could turn out negative for bullion, especially if the Dollar extends its oversold bounce. The Gold SPDR (GLD) became overbought with the surge above 171 and then consolidated with a pennant. There was a breakout attempt on Friday morning, but GLD fell right back to the 172 area. Pennant support is set at 170 and a break would argue for a deeper pullback.
**************************************************************************
Key Reports and Events:
Tue - Sep 25 - 09:00 - Case-Shiller 20-city Index
Tue - Sep 25 - 10:00 - Consumer Confidence
Tue - Sep 25 - 10:00 - FHFA Housing Price Index
Wed - Sep 26 - 07:00 - MBA Mortgage Index
Wed - Sep 26 - 10:00 - New Home Sales
Wed - Sep 26 - 10:30 - Oil Inventories
Thu - Sep 27 - 08:30 - Jobless Claims
Thu - Sep 27 - 08:30 – Durable Goods Orders
Thu - Sep 27 - 08:30 – GDP
Thu - Sep 27 - 10:00 - Pending Home Sales
Fri - Sep 28 - 08:30 - Personal Income & Spending
Fri - Sep 28 - 09:45 - Chicago PMI
Fri - Sep 28 - 09:55 - Michigan Sentiment
Sat – Oct 06 – 09:00 – EU Summit
Charts of Interest: Tuesday and Thursday
This commentary and charts-of-interest are designed to stimulate thinking. This analysis is not a recommendation to buy, sell, hold or sell short any security (stock ETF or otherwise). We all need to think for ourselves when it comes to trading our own accounts. First, it is the only way to really learn. Second, we are the only ones responsible for our decisions. Think of these charts as food for further analysis. Before making a trade, it is important to have a plan. Plan the trade and trade the plan. Among other things, this includes setting a trigger level, a target area and a stop-loss level. It is also important to plan for three possible price movements: advance, decline or sideways. Have a plan for all three scenarios BEFORE making the trade. Consider possible holding times. And finally, look at overall market conditions and sector/industry performance.

About the author:
Arthur Hill, CMT, is the Chief Technical Strategist at TrendInvestorPro.com. Focusing predominantly on US equities and ETFs, his systematic approach of identifying trend, finding signals within the trend, and setting key price levels has made him an esteemed market technician. Arthur has written articles for numerous financial publications including Barrons and Stocks & Commodities Magazine. In addition to his Chartered Market Technician (CMT) designation, he holds an MBA from the Cass Business School at City University in London.
Learn More


