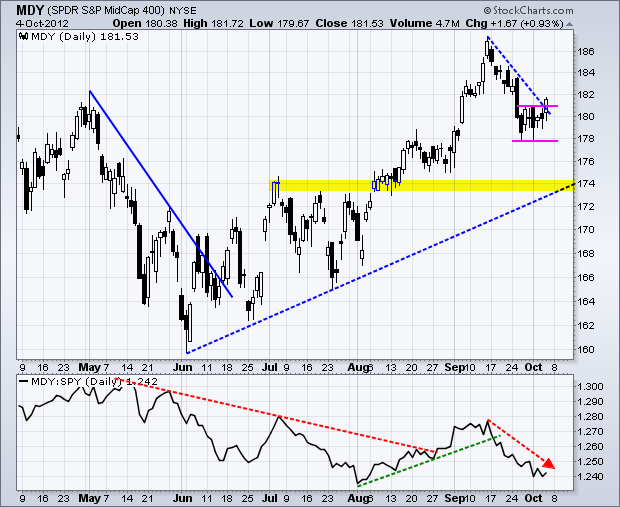
The markets moved to risk-on mode on Thursday as stocks edged higher, treasuries fell, oil surged around 5%, the Dollar fell and the Euro rose. And now for the employment report. The major index ETFs moved modestly higher with the S&P MidCap 400 SPDR (MDY) leading the way (+1.46%). These mid-caps are all over the board, but it is good to see upside leadership here. However, the Russell 2000 ETF (IWM) failed to confirm the breakout. The chart below shows MDY breaking above consolidation resistance with a surge above 181 on Thursday. This breakout is bullish as long as it holds. A move back below 179.50 would negate the breakout. Relative weakness remains a concern though. Notice that the price relative (MDY:SPY ratio) remains in a downtrend since mid September.

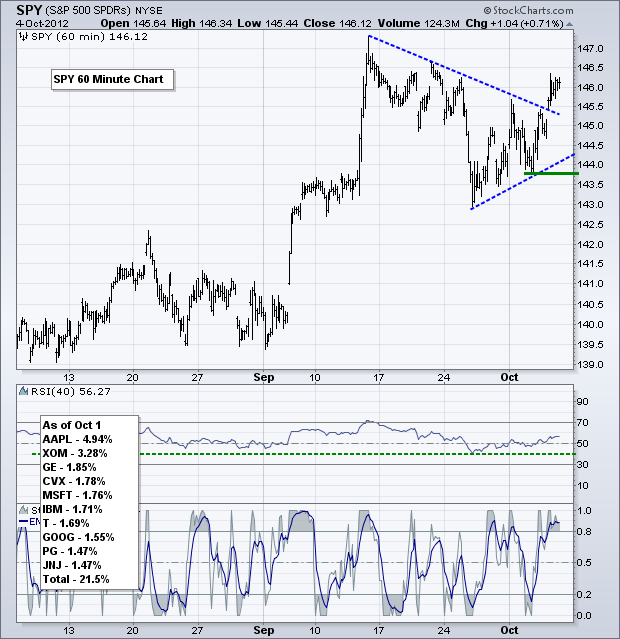
On the 60-minute chart, SPY broke above resistance to reverse the short-term downtrend. The advance started out as a rising flag, which is potentially bearish, but the surge above 145.5 negates this pattern. Keep in mind that the rising flag represents a small uptrend because it is rising. It takes a support break to reverse the small uptrend and confirm the bearish nature of the pattern. As witness with yesterday's surge, not all rising flags are confirmed with a support break. With the surge above last Monday's high, I will set key support at 143.7 and leave RSI support at 40.
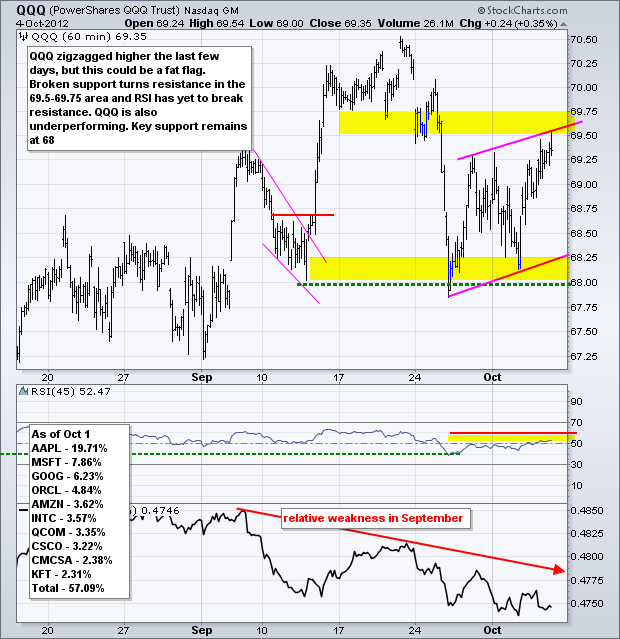
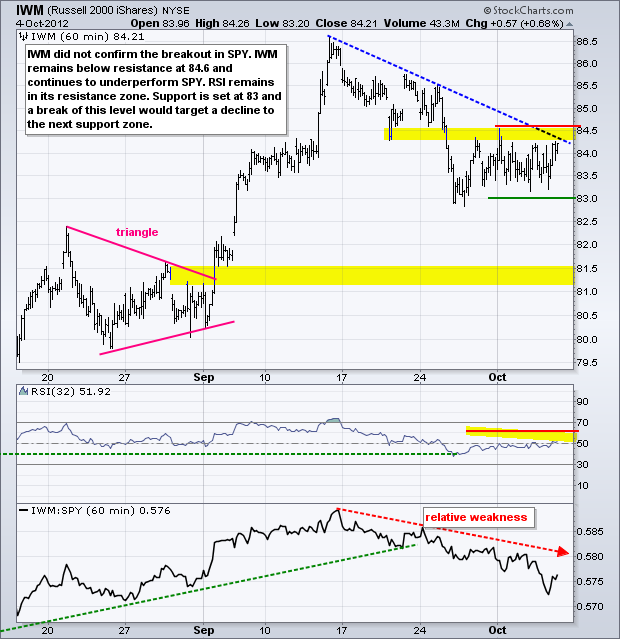
**************************************************************************
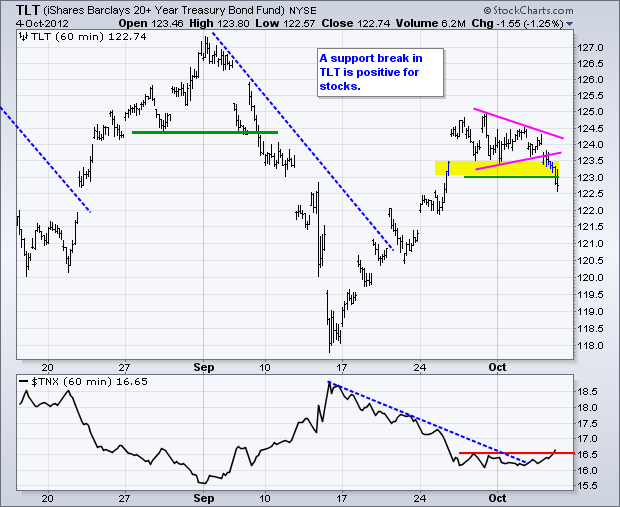
The 20+ Year T-Bond ETF (TLT) surged in late September, consolidated and then broke support with a decline below 123. This support break reverses the short-term uptrend. Also notice that the 10-year Treasury Yield ($TNX) broke above its late September high. Stocks and yields are positively correlated, while stocks and treasuries are negatively correlated. Now let's see if this break will hold as we head into the employment report. A surge back above 123.5 would suggest a bear trap and failed support break.
**************************************************************************
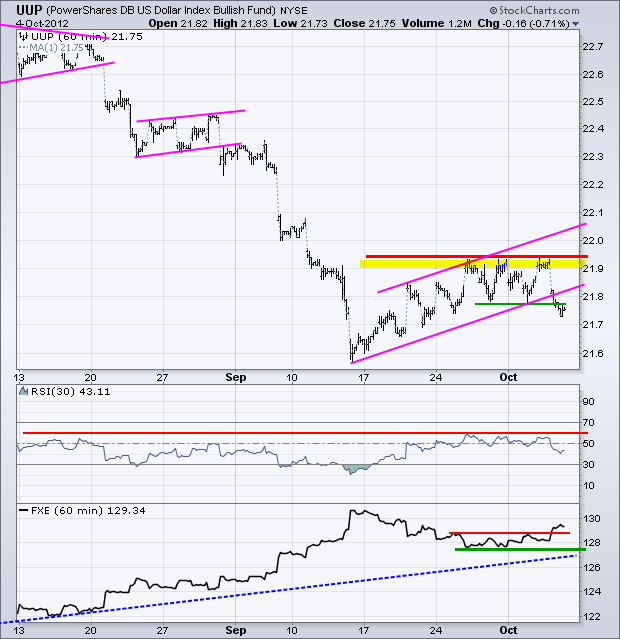
The Euro bulls liked what super Mario (Draghi) had to say at the European Central Bank (ECB) press conference on Thursday. The US Dollar Fund (UUP), which moves opposite the Euro, broke channel support to signal a continuation of the bigger downtrend. This breakdown is positive for stocks and the Euro, provided it holds. Key resistance is set at 21.95 and RSI resistance is set at 60. Breakouts would reverse the downtrend in the Dollar.
**************************************************************************
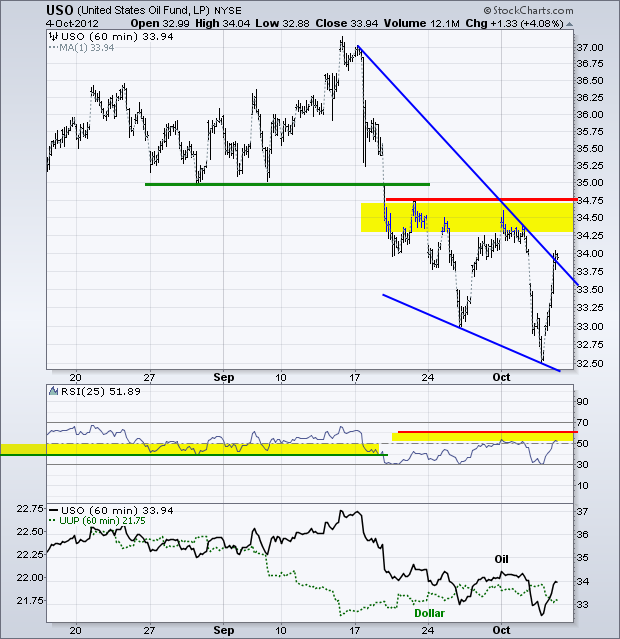
After plunging 4% on Wednesday, the US Oil Fund (USO) surged 4% on Thursday. Oil was oversold after Wednesday's plunge, but the size of the recovery suggests something bigger at work. Oil is part of the risk-on trade. Oil also benefits from weakness in the Dollar. Perhaps the breakdown in the Dollar and surge in mid-caps pushed money into crude. On the price chart, USO remains in a downtrend with broken support turning resistance. Look for a follow through break above 34.75 and an RSI break above 60 to fully reverse the downtrend.
**************************************************************************
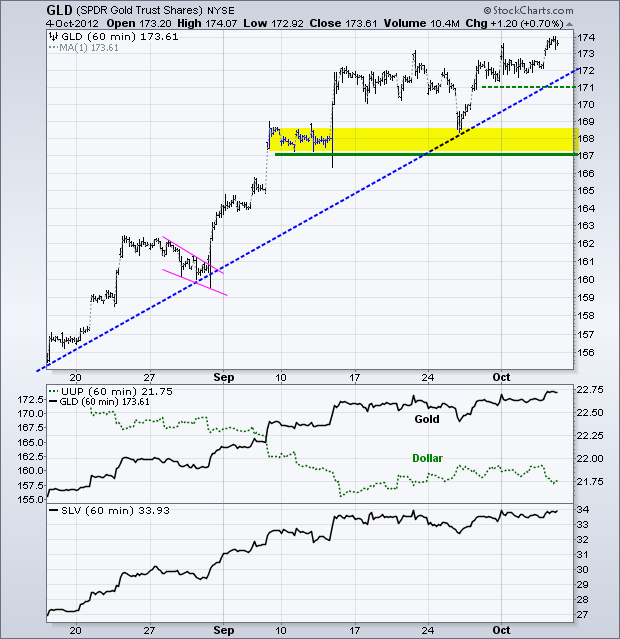
The channel break in UUP pushed money into gold as the Gold SPDR (GLD) broke above 173 and held above 173 on Thursday. This simply extends the uptrend and does little to change the overall chart picture. I can mark first support at 171, but key support remains in the 167-167 area.
**************************************************************************
Key Reports and Events:
Fri - Oct 05 - 08:30 - Employment Report
Mon - Oct 08 - 09:00 – EU Finance Ministers Meet
Tue - Oct 09 - 09:00 - EU Finance Ministers Meet
Thu – Oct 18 – 09:00 – EU Summit
Fri – Oct 19 – 09:00 – EU Summit
Charts of Interest: Tuesday and Thursday
This commentary and charts-of-interest are designed to stimulate thinking. This analysis is not a recommendation to buy, sell, hold or sell short any security (stock ETF or otherwise). We all need to think for ourselves when it comes to trading our own accounts. First, it is the only way to really learn. Second, we are the only ones responsible for our decisions. Think of these charts as food for further analysis. Before making a trade, it is important to have a plan. Plan the trade and trade the plan. Among other things, this includes setting a trigger level, a target area and a stop-loss level. It is also important to plan for three possible price movements: advance, decline or sideways. Have a plan for all three scenarios BEFORE making the trade. Consider possible holding times. And finally, look at overall market conditions and sector/industry performance.

About the author:
Arthur Hill, CMT, is the Chief Technical Strategist at TrendInvestorPro.com. Focusing predominantly on US equities and ETFs, his systematic approach of identifying trend, finding signals within the trend, and setting key price levels has made him an esteemed market technician. Arthur has written articles for numerous financial publications including Barrons and Stocks & Commodities Magazine. In addition to his Chartered Market Technician (CMT) designation, he holds an MBA from the Cass Business School at City University in London.
Learn More


