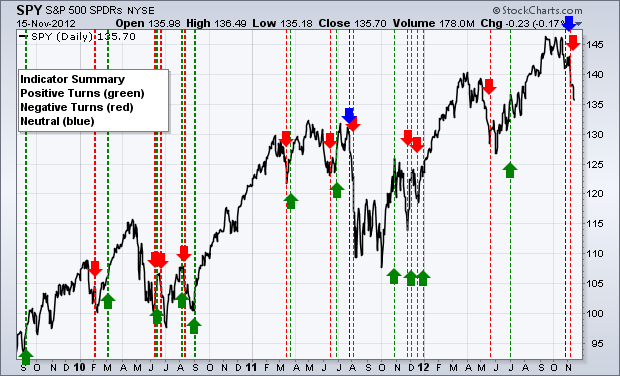
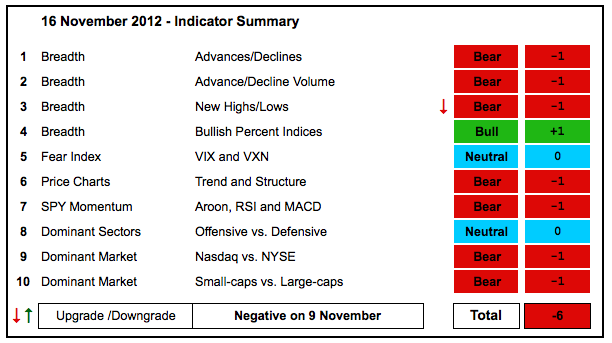
The bulk of the evidence remains decidedly bearish. Even though stocks are oversold, the decline accelerated the last two weeks and we have yet to see any kind of selling climax or washout that would indicate a near-term bottom. We have also yet to see support in the major index ETFs or relative performance improve for technology sector. There was another downgrade as the Net New Highs indicators are now considered bearish overall. These indicators lag because they are based on 52-week highs and lows. Also note that the Bullish Percent Indices are also lagging indicators because they are based on daily P&F chart signals. Most daily P&F charts extend over a year and their signals tend to be long-term.
- AD Lines: Bearish. The Nasdaq AD Line broke below channel support in November and reversed the 5-month uptrend. The NYSE AD Line broke below its late September low and is nearing the trend line extending up from October 2011.
- AD Volume Lines: Bearish. The Nasdaq AD Volume Line formed a large bearish divergence with the September peak and broke support in mid October. The NYSE AD Volume Line peaked in mid September and broke down in November.
- Net New Highs: Bearish. Nasdaq Net New Highs dipped to their lowest level since May and the cumulative line crossed below the 10-day EMA in early November. NYSE Net New Highs turned negative and the cumulative line now equals the 10-day EMA. It is close to a bearish cross.
- Bullish Percent Indices: Bullish. Eight of the nine sector BPIs are above 50%. The Technology Bullish% Index ($BPINFO) was the first to fall below 50% (44.3%) and the Consumer Discretionary Bullish% Index ($BPDISC) is the next closest (51.85%).
- VIX/VXN: Neutral. The Nasdaq 100 Volatility Index ($VXN) and the S&P 500 Volatility Index ($VIX) are still below 20. This is a bit strange because reflects little fear amongst option traders. A true bottom in stocks may not occur until these volatility indices spike and we see some fear in the market.
- Trend-Structure: Bearish. DIA, IWM, MDY, QQQ and SPY recorded 52-week highs in September and then moved into corrective mode. The current downtrends are nine week's old and accelerating. This acceleration is negative and the November highs now mark first resistance.
- SPY Momentum: Bearish. RSI broke below 40 in late October and moved below 30 for the first time since May. MACD(5,35,5) turned negative and moved to its lowest level since early June. Aroon turned bearish with a move below -50 in mid October.
- Offensive Sector Performance: Neutral. XLK remains by far the weakest sector. XLY, XLI and XLF are still outperforming the S&P 500 on the one and three month timeframes.
- Nasdaq Performance: Bearish. The $COMPQ:$NYA ratio peaked in early September and broke down in October. The Nasdaq shows some serious relative weakness.
- Small-cap Performance: Bearish. The $RUT:$OEX ratio turned lower in November and small-caps are starting to underperform again. The overall trend in the price relative has been down since February 2012.
- Breadth Charts (here) and Inter-market charts (here) have been updated.

Previous turns include:
Negative on 9-November-12
Neutral on 26-October-12
Positive on 6-July-12
Negative on 18-May-12
Positive on 30-December-11
Negative on 16-December-11
Positive on 3-December-11
Negative on 23-November-11
Positive on 28-October-11
Negative on 5-August-11
Neutral on 29-Jul-11
Positive on 30-Jun-11
Negative on 17-Jun-11
Positive on 25-Mar-11
Negative on 18-Mar-11
Positive on 3-Sep-10
Negative on 13-Aug-10
Positive on 6-Aug-10
Negative on 24-Jun-10
Positive on 18-Jun-10
Negative on 11-Jun-10
Positive on 5-March-10
Negative on 5-Feb-10
Positive on 11-Sept-09

About the author:
Arthur Hill, CMT, is the Chief Technical Strategist at TrendInvestorPro.com. Focusing predominantly on US equities and ETFs, his systematic approach of identifying trend, finding signals within the trend, and setting key price levels has made him an esteemed market technician. Arthur has written articles for numerous financial publications including Barrons and Stocks & Commodities Magazine. In addition to his Chartered Market Technician (CMT) designation, he holds an MBA from the Cass Business School at City University in London.
Learn More


