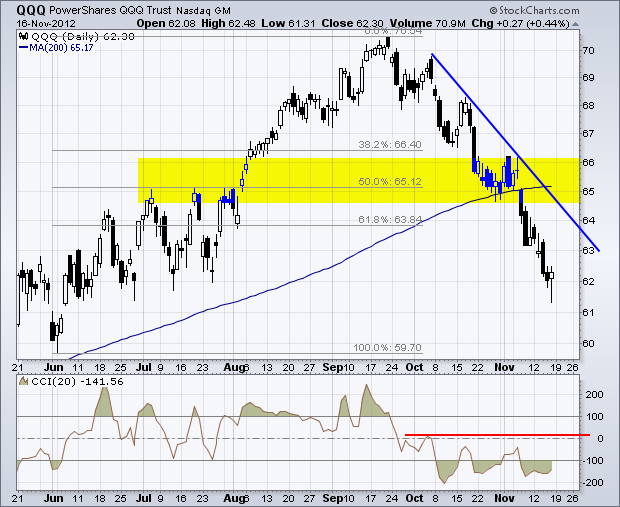
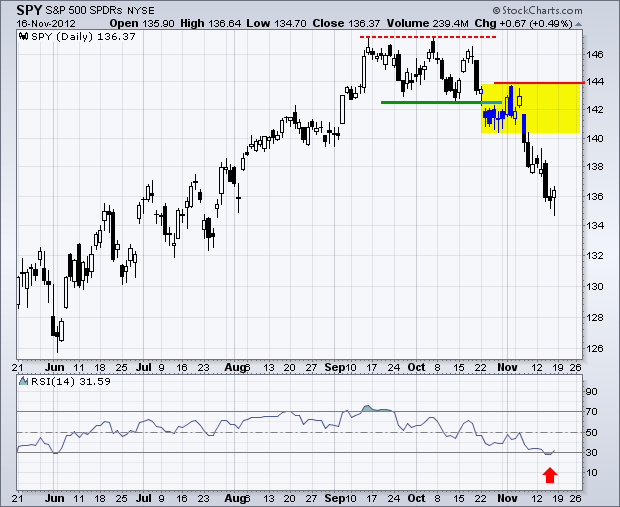
Programming note: I will be taking some time off for Thanksgiving and the next commentary will appear on November 27th. Stocks managed to firm on Friday with a number of ETFs forming hammer-like candlesticks. Hammers form with small bodies near the top of the high-low range. The open and close (bodies) are well above the intraday low and near the intraday high. Such price action reflects an intraday recovery that could foreshadow a short-term bounce. A move above Friday's high would suggest a continuation of the recovery. This is bullish as long as it holds and a move below Friday's open would negate the signal. The trade works if the bounce continues and fails should the bounce quickly reverse.
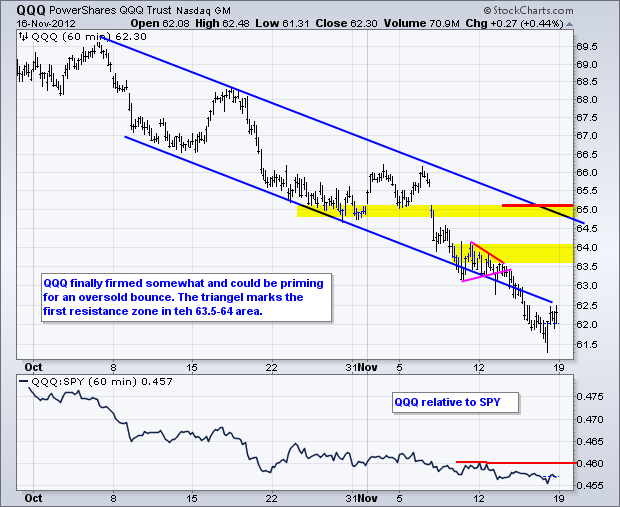
Overall, stocks remain deeply oversold and ripe for a consolidation or an oversold bounce. This is still bottom picking territory and risk remains high that the first bounce will not be meaningful. The charts above show SPY and QQQ with hammers on Friday. There are small consolidations extending from late October to early November that mark the first resistance zones. Note that QQQ is down over 12% from its mid September high and SPY is down over 7% from this high. RSI for SPY became oversold for the first time since early June. CCI for QQQ is bouncing in and out of oversold territory.
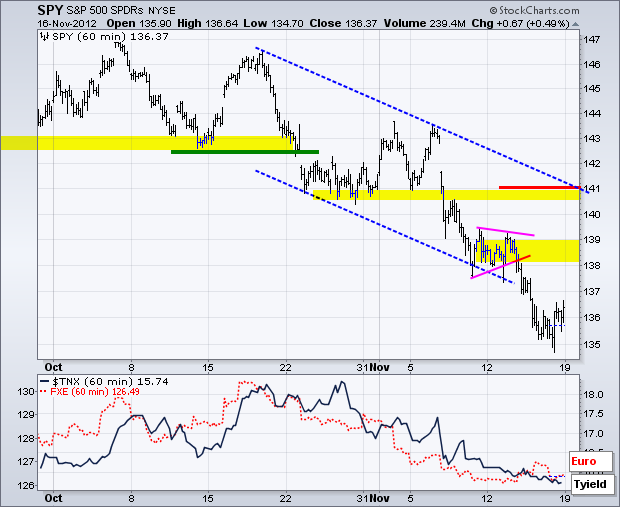
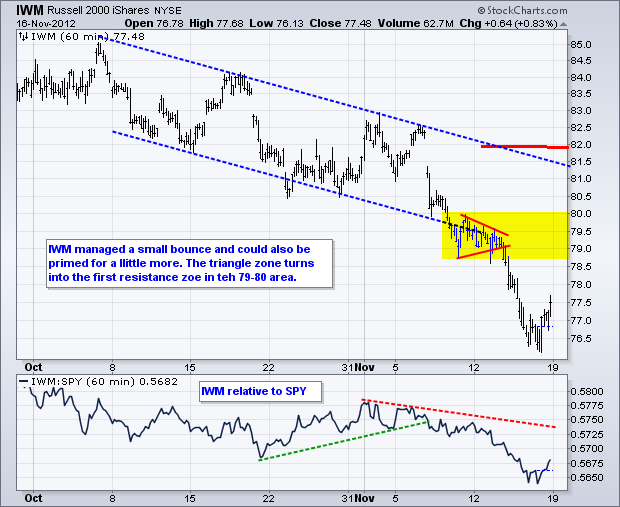
Timing an oversold bounce is tricky stuff. First, the bigger downtrend remains the dominant force. Second, this downtrend could pull rank at anytime and cut a bounce short. The fiscal cliff is dominating the news, but we are unlikely to see any progress until the week after Thanksgiving, which is when the House and Senate will both be in session. The bears risk a positive surprise that could send stocks sharply higher. I suspect we will see a temporary fix to avoid the cliff for a few months. We can, however, expect lots of political brinkmanship and a deal might not come until the last minute, which would be the second week of December. A bigger fix is unlikely until the new congress convenes in 2013. Until something concrete emerges, the market could be whipsawed on news and innuendo. My strategy is to turn off the TV or hit the mute button when talk turns to the fiscal cliff. Also note that trading volume will thin Wednesday and Friday. The 60 minute chart for SPY shows last week's triangle marking a resistance zone in the 138-139 area. This is the first target for an oversold bounce.
Timing an oversold bounce is tricky stuff. First, the bigger downtrend remains the dominant force. Second, this downtrend could pull rank at anytime and cut a bounce short. The fiscal cliff is dominating the news, but we are unlikely to see any progress until the week after Thanksgiving, which is when the House and Senate will both be in session. The bears risk a positive surprise that could send stocks sharply higher. I suspect we will see a temporary fix to avoid the cliff for a few months. We can, however, expect lots of political brinkmanship and a deal might not come until the last minute, which would be the second week of December. A bigger fix is unlikely until the new congress convenes in 2013. Until something concrete emerges, the market could be whipsawed on news and innuendo. My strategy is to turn off the TV or hit the mute button when talk turns to the fiscal cliff. Also note that trading volume will thin Wednesday and Friday. The 60 minute chart for SPY shows last week's triangle marking a resistance zone in the 138-139 area. This is the first target for an oversold bounce.
**************************************************************************
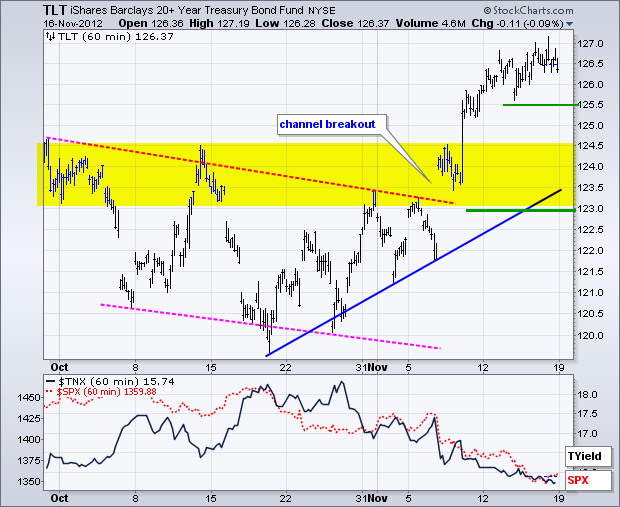
The 20+ Year T-Bond ETF (TLT) surged after the election and held its gains last week. Weakness in the stock market pushed money into safe-haven treasuries again last week. Stocks are unlikely to rally as long as treasuries remain strong. On the price chart, last week's low marks first support. A break below this level would argue for a correction into the yellow support zone.
**************************************************************************
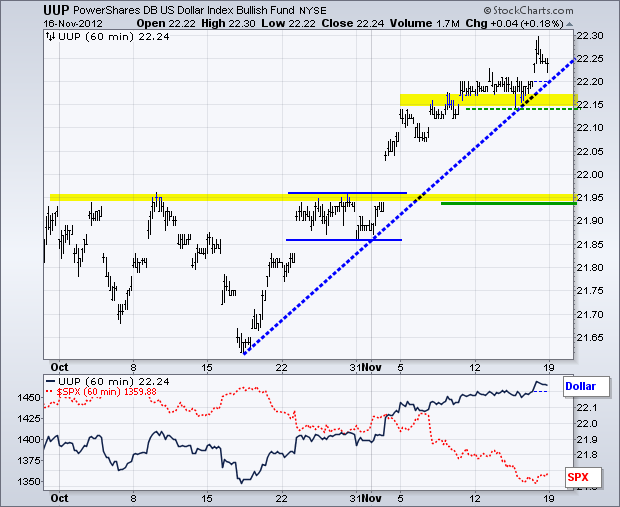
The Dollar Bullish ETF (UUP) caught a bid on Friday with a break above consolidation resistance. This affirms the current uptrend, which is looking quite strong. Last week's low now marks first support. A move below the mid October trendline and this low would argue for a correction that could extend to broken resistance in the 21.95 area. A Dollar correction would be positive for stocks and gold, but continued strength would be negative.
**************************************************************************
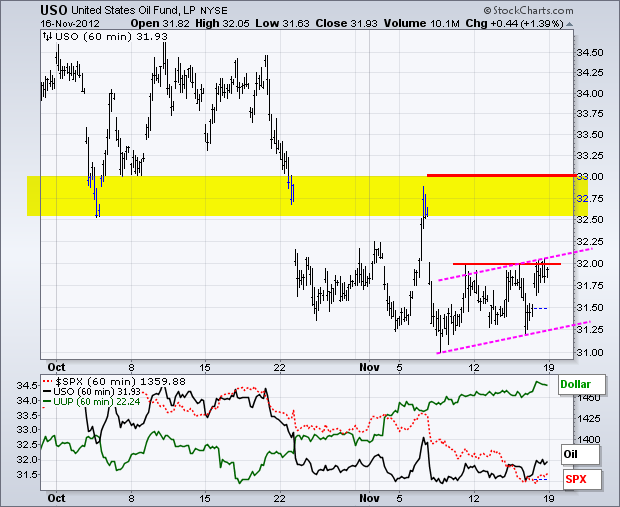
The US Oil Fund (USO) continues to show signs of life. This is particularly impressive because the Dollar surged on Friday and stocks were down in early trading. USO started the day strong and finished near its intraday high. A slight uptrend is taking shape since the post-election swoon. This could, however, be a rising flag of sorts and a break below last week's low would signal a continuation lower. For now, I am impressed with oil's ability to hold up over the last six days and we could see an extended bounce towards resistance in the 33 area.
**************************************************************************
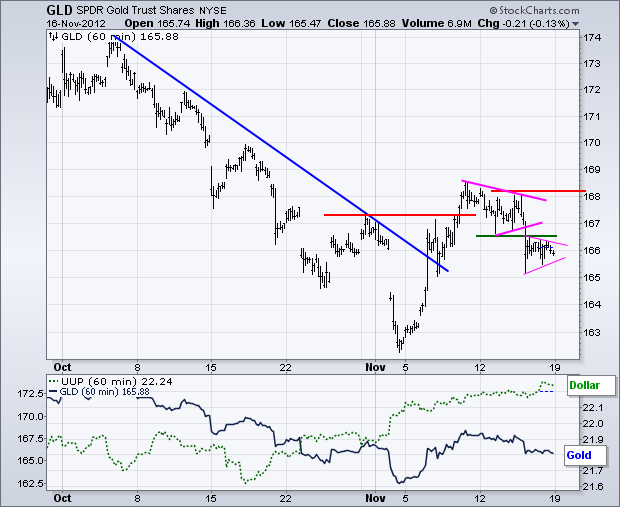
The Gold SDPR (GLD) hit resistance in the 168-169 area after the election and broke short-term support last week. A triangle formed during the week. This is normally a bullish continuation pattern because the prior move was up. However, these patterns sometimes resolve themselves otherwise. The breakdown in the Gold Miners ETF (GDX) and continued strength in the Dollar remain negatives for bullion. I am marking resistance just above 168. A recovery and break above this level would be quite bullish. Gold will likely need some help from the greenback, which is not cooperating at the moment.
**************************************************************************
Key Reports and Events:
Mon - Nov 19 - 10:00 - Existing Home Sales
Mon - Nov 19 - 10:00 - NAHB Housing Market Index
Tue - Nov 20 - 08:30 - Housing Starts/Building Permits
Wed - Nov 21 - 07:00 - MBA Mortgage Index
Wed - Nov 21 - 08:30 - Initial Claims
Wed - Nov 21 - 09:55 - Michigan Sentiment
Wed - Nov 21 - 10:00 - Leading Indicators
Wed - Nov 21 - 10:30 - Crude Inventories
Thu - Nov 22 - 08:00 - Gobble gobble...
Tue - Nov 27 - 10:30 - House and Senate in Session
Fri - Dec 14 - 18:00 - Congressional Recess
Charts of Interest: Gone fishing until November 27th.
This commentary and charts-of-interest are designed to stimulate thinking. This analysis is not a recommendation to buy, sell, hold or sell short any security (stock ETF or otherwise). We all need to think for ourselves when it comes to trading our own accounts. First, it is the only way to really learn. Second, we are the only ones responsible for our decisions. Think of these charts as food for further analysis. Before making a trade, it is important to have a plan. Plan the trade and trade the plan. Among other things, this includes setting a trigger level, a target area and a stop-loss level. It is also important to plan for three possible price movements: advance, decline or sideways. Have a plan for all three scenarios BEFORE making the trade. Consider possible holding times. And finally, look at overall market conditions and sector/industry performance.

About the author:
Arthur Hill, CMT, is the Chief Technical Strategist at TrendInvestorPro.com. Focusing predominantly on US equities and ETFs, his systematic approach of identifying trend, finding signals within the trend, and setting key price levels has made him an esteemed market technician. Arthur has written articles for numerous financial publications including Barrons and Stocks & Commodities Magazine. In addition to his Chartered Market Technician (CMT) designation, he holds an MBA from the Cass Business School at City University in London.
Learn More
