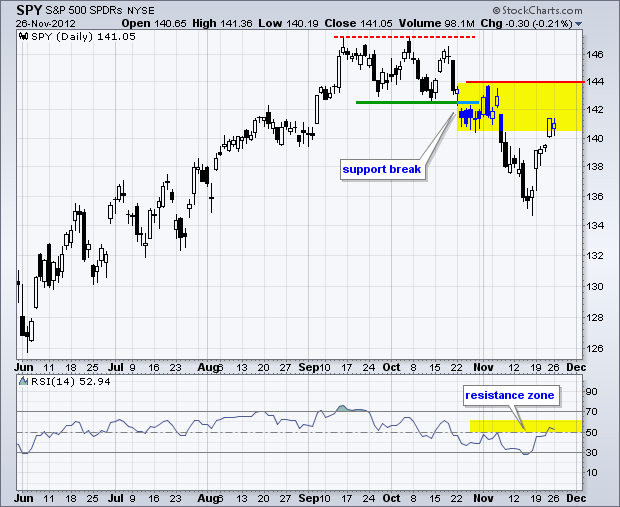
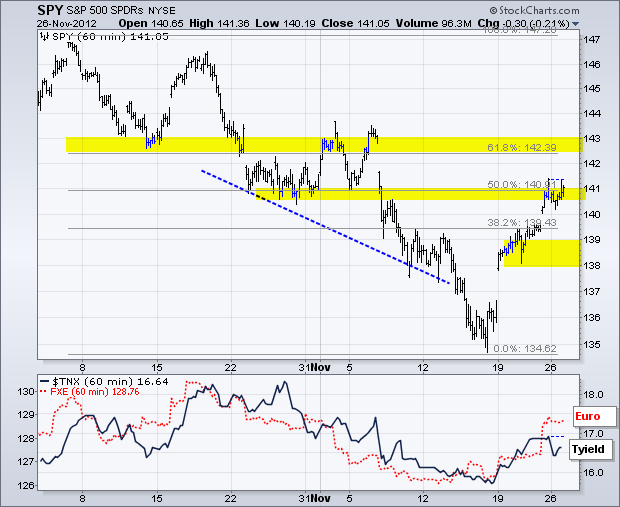
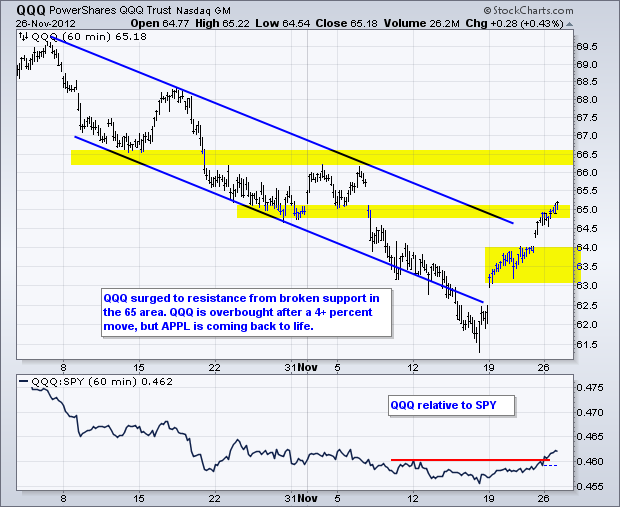
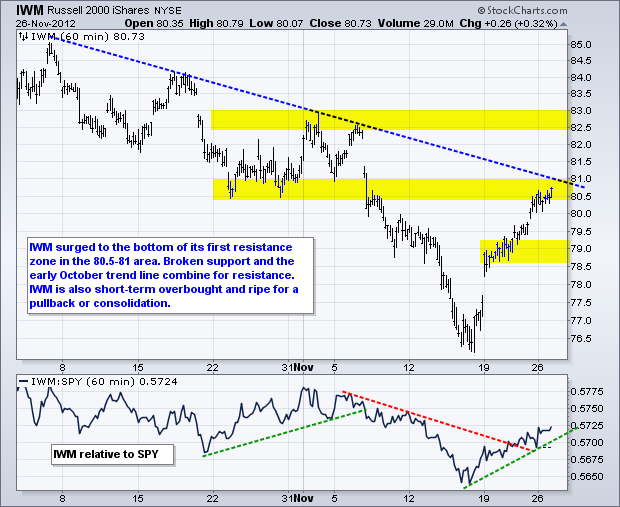
The markets started November in risk-off mode as stocks and the Euro moved sharply lower. Both became quite oversold mid month and the major index ETFs formed hammers on Friday, November 16th. These minor selling climaxes marked a short-term turning point as the markets devoured risk the following week. Stocks, the Euro and gold surged, while the Dollar and treasuries fell as we moved into black Friday. At this point, I consider this an oversold bounce for stocks and the Euro. This means the bigger trends are still down. Conversely, the declines in the Dollar and Treasuries are considered corrections within a bigger uptrend. Now that stocks have alleviated the mid-November oversold condition, we could be in for some choppy trading as the bulls and bears fight for directional control. It's the medium-term downtrend versus the short-term uptrend.
The S&P 500 ETF (SPY) formed a hammer on November 16th and followed through with a gap the following Monday. With SPY closing up and holding the gap, the hammer was confirmed and the oversold bounce took hold. Stocks extended their gains throughout the week as SPY closed above 140. Even though the short-term trend is up, the medium-term trend is down and SPY is running into its first resistance zone in the 141 area. Broken support and the 50% retracement combine for a resistance tandem. Also note that SPY has gone from short-term oversold to overbought with a 4+ percent gain from low to high (135 to 141). This means we could see a stall or pullback to digest these gains and alleviate overbought conditions. The 139-139 area becomes first support to watch on any pullback. Further up, the 143 area marks the next resistance zone to watch.
**************************************************************************
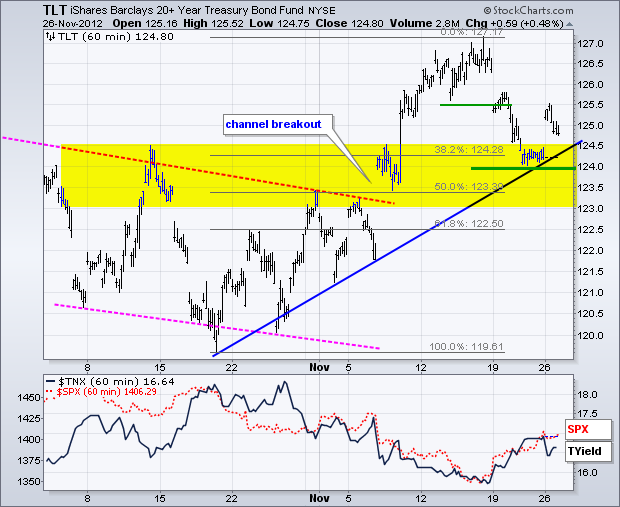
Strength in stocks and the Euro pushed money into treasuries as the 20+ Year T-Bond ETF (TLT) declined to the top of its support zone. Support stems from broken resistance levels and the mid October trend line. TLT affirmed support with a surge off support early Monday. This means the short-term trend (five weeks) is up and I am marking key support at 124. A break below 124 would be bearish for treasuries and bullish for stocks. The Durable Goods report is on deck Tuesday morning and the Fed offers up its beige book on Wednesday. Any signs of economic strength would be bearish for treasuries. Signs of weakness would be bullish.
**************************************************************************
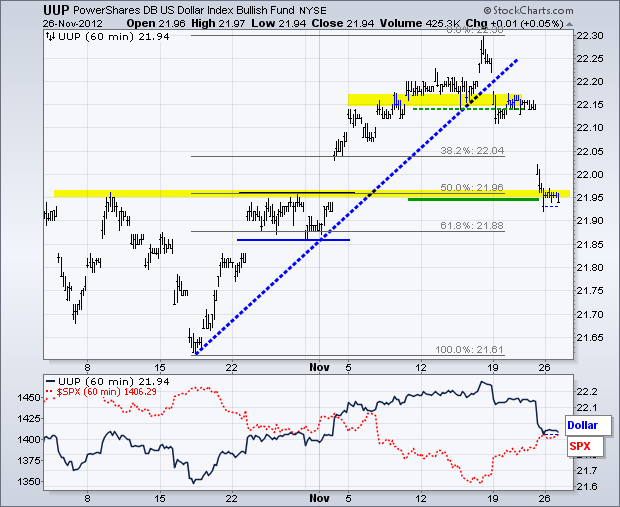
The Dollar Bullish ETF (UUP) took a big hit with a return to broken resistance. UUP broke support on November 19th and plunged to broken resistance last week. This is the first big test because a strong breakout should hold. I would be more inclined to mark a bigger support zone in the 21.85-21.90 area because of the late October consolidation and the 62% retracement. In other words, this looks like a post-breakout throwback. The 50% retracement line confirms support in this area. Playing the throwback is challenging because a falling wedge or falling flag did not form. In other words, traders do not have a pattern upon which to base a bullish continuation breakout. Turning bullish now would be a bottom picking exercise based on the premise that the breakout zone will ultimately hold.
**************************************************************************
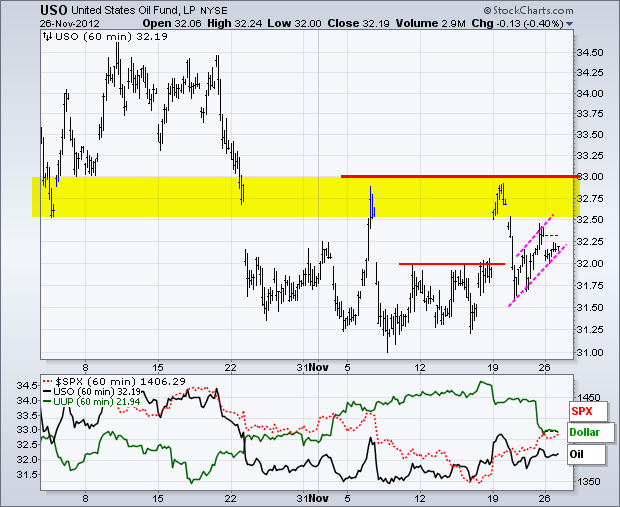
The US Oil Fund (USO) remains in the doghouse. Despite tensions in the Middle East, oil cannot hold a bid and forge a breakout. It seems that weakness in global demand is weighing on the oil market. In fact, a pair of regional Fed reports on Monday confirmed weakness in the US economy. On the price chart, USO failed at broken support twice this month. Even though stocks surged and the Dollar fell, USO turned back at resistance last week. This reinforces resistance at 33 and a breakout is needed to reverse the downtrend. A small rising consolidation formed the last few days and a break below 32 would signal a continuation of last week's sharp decline.
**************************************************************************
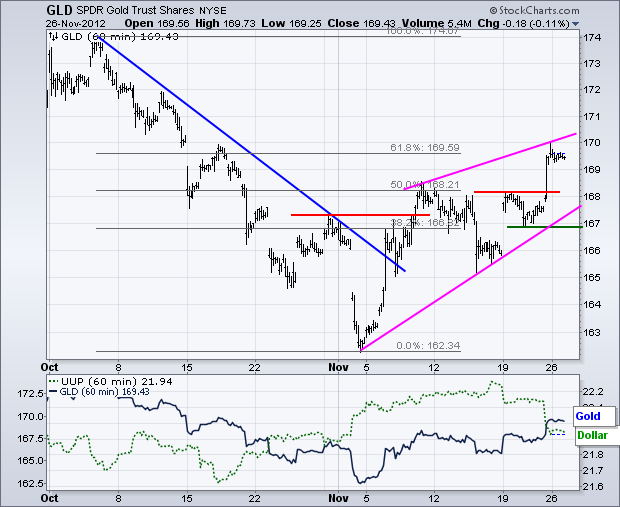
A surging stock market and falling Dollar boosted gold as the yellow metal surged above its early November highs. The Gold SDPR (GLD) jumped on November 19th, stalled and surged again on Friday. The short-term trend is up with this breakout near 168, but resistance could be nigh as the 62% retracement comes into play. Overall, a rising wedge is taking shape since early November and the bulls have an edge as long as it rises. First support is based on last week's low in the 167 area. A move below this low would negate Friday's surge and also break the early November trend line.
**************************************************************************
Key Reports and Events:
Mon - Nov 19 - 10:00 - Existing Home Sales
Mon - Nov 19 - 10:00 - NAHB Housing Market Index
Tue - Nov 27 - 08:30 - Durable Goods Orders
Tue - Nov 27 - 09:00 - Case-Shiller 20-city Index
Tue - Nov 27 - 10:00 - Consumer Confidence
Tue - Nov 27 - 10:00 - FHFA Housing Price Index
Wed - Nov 28 - 07:00 - MBA Mortgage Index
Wed - Nov 28 - 10:00 - New Home Sales
Wed - Nov 28 - 10:30 - Oil Inventories
Wed - Nov 28 - 14:00 - Fed's Beige Book
Thu - Nov 29 - 08:30 - Jobless Claims
Thu - Nov 29 - 08:30 - GDP
Thu - Nov 29 - 10:00 - Pending Home Sales
Fri - Nov 30 - 08:30 - Personal Income/Spending
Fri - Nov 30 - 09:45 - Chicago PMI
Charts of Interest: Tuesday and Thursday
This commentary and charts-of-interest are designed to stimulate thinking. This analysis is not a recommendation to buy, sell, hold or sell short any security (stock ETF or otherwise). We all need to think for ourselves when it comes to trading our own accounts. First, it is the only way to really learn. Second, we are the only ones responsible for our decisions. Think of these charts as food for further analysis. Before making a trade, it is important to have a plan. Plan the trade and trade the plan. Among other things, this includes setting a trigger level, a target area and a stop-loss level. It is also important to plan for three possible price movements: advance, decline or sideways. Have a plan for all three scenarios BEFORE making the trade. Consider possible holding times. And finally, look at overall market conditions and sector/industry performance.


**************************************************************************
Strength in stocks and the Euro pushed money into treasuries as the 20+ Year T-Bond ETF (TLT) declined to the top of its support zone. Support stems from broken resistance levels and the mid October trend line. TLT affirmed support with a surge off support early Monday. This means the short-term trend (five weeks) is up and I am marking key support at 124. A break below 124 would be bearish for treasuries and bullish for stocks. The Durable Goods report is on deck Tuesday morning and the Fed offers up its beige book on Wednesday. Any signs of economic strength would be bearish for treasuries. Signs of weakness would be bullish.

**************************************************************************
The Dollar Bullish ETF (UUP) took a big hit with a return to broken resistance. UUP broke support on November 19th and plunged to broken resistance last week. This is the first big test because a strong breakout should hold. I would be more inclined to mark a bigger support zone in the 21.85-21.90 area because of the late October consolidation and the 62% retracement. In other words, this looks like a post-breakout throwback. The 50% retracement line confirms support in this area. Playing the throwback is challenging because a falling wedge or falling flag did not form. In other words, traders do not have a pattern upon which to base a bullish continuation breakout. Turning bullish now would be a bottom picking exercise based on the premise that the breakout zone will ultimately hold.

**************************************************************************
The US Oil Fund (USO) remains in the doghouse. Despite tensions in the Middle East, oil cannot hold a bid and forge a breakout. It seems that weakness in global demand is weighing on the oil market. In fact, a pair of regional Fed reports on Monday confirmed weakness in the US economy. On the price chart, USO failed at broken support twice this month. Even though stocks surged and the Dollar fell, USO turned back at resistance last week. This reinforces resistance at 33 and a breakout is needed to reverse the downtrend. A small rising consolidation formed the last few days and a break below 32 would signal a continuation of last week's sharp decline.

**************************************************************************
A surging stock market and falling Dollar boosted gold as the yellow metal surged above its early November highs. The Gold SDPR (GLD) jumped on November 19th, stalled and surged again on Friday. The short-term trend is up with this breakout near 168, but resistance could be nigh as the 62% retracement comes into play. Overall, a rising wedge is taking shape since early November and the bulls have an edge as long as it rises. First support is based on last week's low in the 167 area. A move below this low would negate Friday's surge and also break the early November trend line.

**************************************************************************
Key Reports and Events:
Mon - Nov 19 - 10:00 - Existing Home Sales
Mon - Nov 19 - 10:00 - NAHB Housing Market Index
Tue - Nov 27 - 08:30 - Durable Goods Orders
Tue - Nov 27 - 09:00 - Case-Shiller 20-city Index
Tue - Nov 27 - 10:00 - Consumer Confidence
Tue - Nov 27 - 10:00 - FHFA Housing Price Index
Wed - Nov 28 - 07:00 - MBA Mortgage Index
Wed - Nov 28 - 10:00 - New Home Sales
Wed - Nov 28 - 10:30 - Oil Inventories
Wed - Nov 28 - 14:00 - Fed's Beige Book
Thu - Nov 29 - 08:30 - Jobless Claims
Thu - Nov 29 - 08:30 - GDP
Thu - Nov 29 - 10:00 - Pending Home Sales
Fri - Nov 30 - 08:30 - Personal Income/Spending
Fri - Nov 30 - 09:45 - Chicago PMI
Charts of Interest: Tuesday and Thursday
This commentary and charts-of-interest are designed to stimulate thinking. This analysis is not a recommendation to buy, sell, hold or sell short any security (stock ETF or otherwise). We all need to think for ourselves when it comes to trading our own accounts. First, it is the only way to really learn. Second, we are the only ones responsible for our decisions. Think of these charts as food for further analysis. Before making a trade, it is important to have a plan. Plan the trade and trade the plan. Among other things, this includes setting a trigger level, a target area and a stop-loss level. It is also important to plan for three possible price movements: advance, decline or sideways. Have a plan for all three scenarios BEFORE making the trade. Consider possible holding times. And finally, look at overall market conditions and sector/industry performance.

About the author:
Arthur Hill, CMT, is the Chief Technical Strategist at TrendInvestorPro.com. Focusing predominantly on US equities and ETFs, his systematic approach of identifying trend, finding signals within the trend, and setting key price levels has made him an esteemed market technician. Arthur has written articles for numerous financial publications including Barrons and Stocks & Commodities Magazine. In addition to his Chartered Market Technician (CMT) designation, he holds an MBA from the Cass Business School at City University in London.
Learn More
