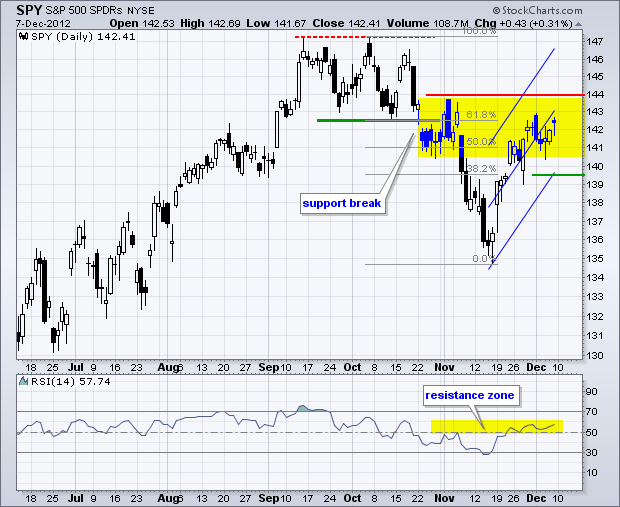
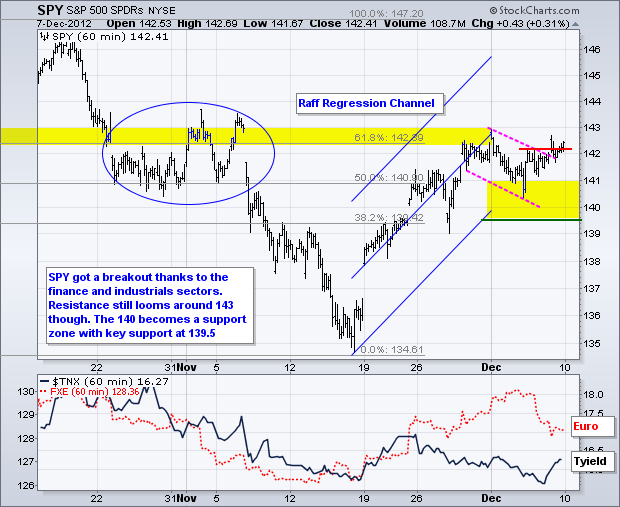
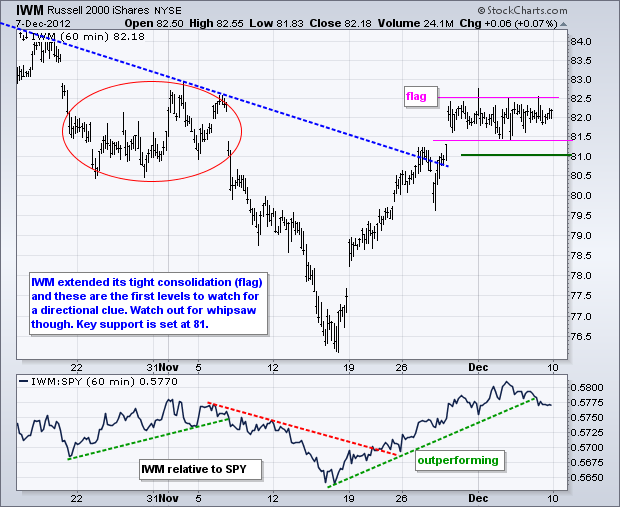
Stocks remain dazed and confused. After falling sharply the first two weeks of November, stocks bottomed in mid November and surged the next two weeks. These gains wiped out the early November losses and made it as if November never really happened. Despite this strong rally, stocks hit a wall around 29-November as trading turned flat the last six trading days. The Russell 2000 ETF (IWM) has traded in a narrow range around 82, while the S&P 500 ETF (SPY) has fluctuated around 142 the last six days. Notice that SPY is meeting resistance from broken support, the early November high and the 50-61.80% retracement zone. The swing since mid November is still up with the Raff Regression Channel marking support at 139.50. A break below this level would reverse the short-term upswing and signal a continuation of the October-November decline.

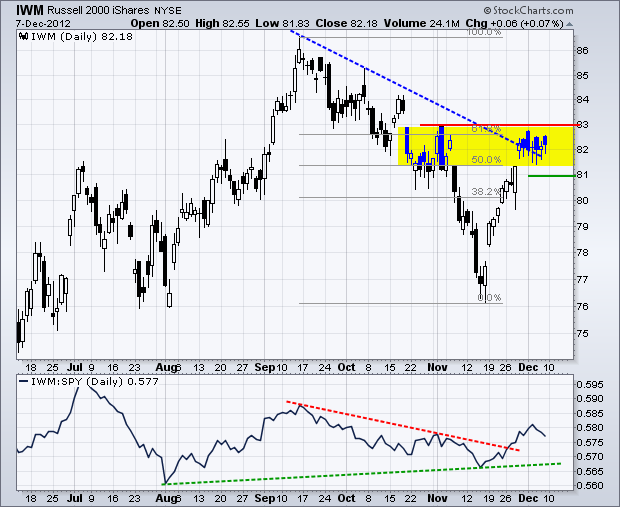
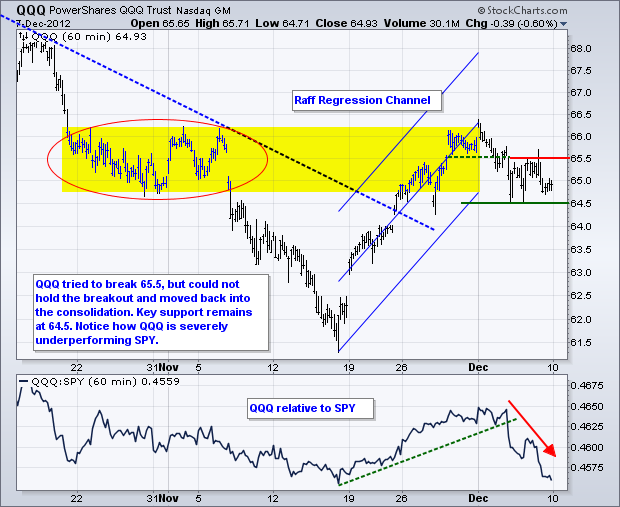
There are three themes running through the markets this week. First, fiscal cliff jawboning and speculation will continue. The odds favor a kick-the-can down the road kind of deal before yearend. This means the real work (a grand bargain) will continue with the new congress in 2013. Stocks could surge on any announcement, but I am not sure if this surge will be sustainable. Second, the Fed meets this week and Fed days always produce a little extra volatility. The Fed is picking up the fiscal slack with its unending quantitative easing programs. We could see more talk of quantitative easing on Wednesday. Third, the technology sector continues to underperform the broader market and Apple is the big reason.
**************************************************************************
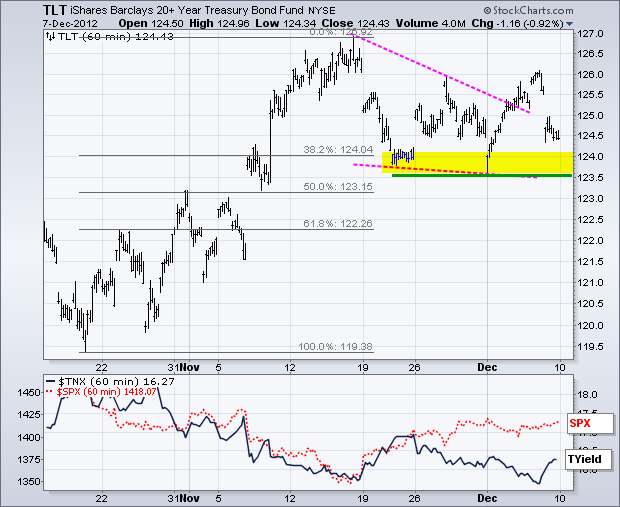
The 20+ Year T-Bond ETF (TLT) got a smack-down after the better-than-expected jobs report on Friday. TLT broke resistance mid week and then moved back below this breakout on Friday. TLT is, however, still above its mid November low and still in a slight uptrend the last few weeks. A move below 123.5 would break support and fully reverse this slight uptrend. Such a move would be bullish for stocks. Treasuries will be on the hot seat again this week as the Fed meets.
**************************************************************************
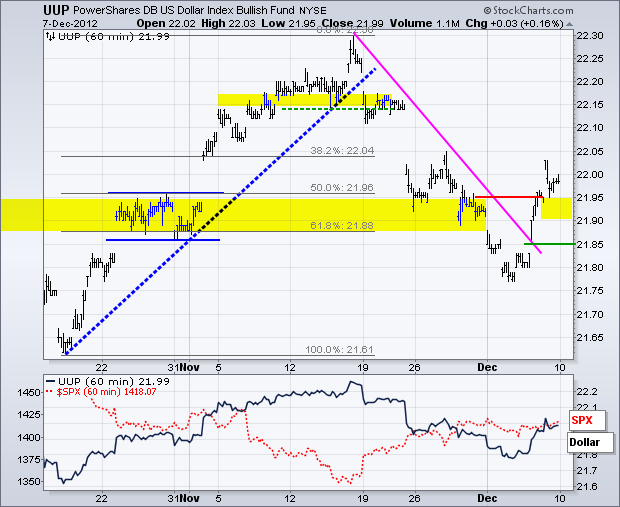
The Dollar got a boost from the jobs report because it put less pressure on the Fed for quantitative easing. It did not, however, totally excuse the Fed from quantitative easing because Washington DC has been impotent on the fiscal side of the equation. The US Dollar Fund (UUP) broke resistance with a surge above 21.95 late last week and this breakout is holding so far. A quick move below 21.85 would throw cold water on the breakout.
**************************************************************************
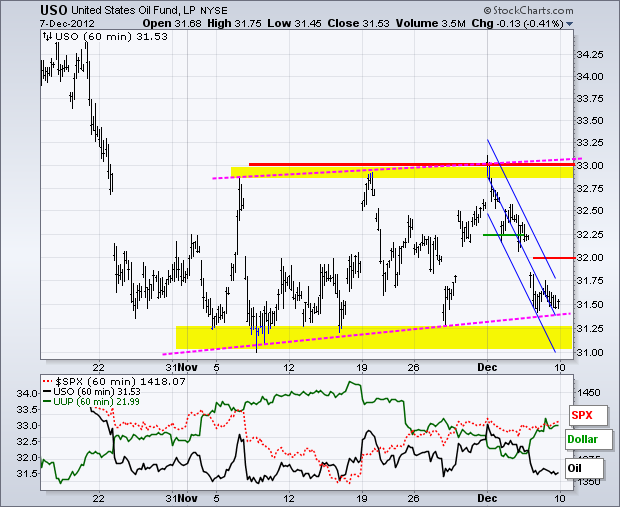
The US Oil Fund (USO) continues to be range bound since late October. The swings within this range hit resistance near 33 and find support near 31.25. The pattern since late October looks like a rising flag on the daily chart and a break below 31.25 would signal a continuation lower. The swing within this consolidation is down with the Raff Regression Channel and a buffer marking first resistance at 32.
**************************************************************************
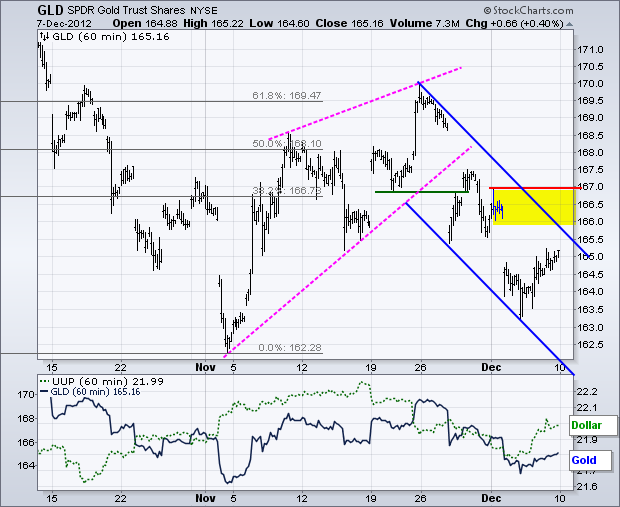
Gold followed the Dollar as both moved lower at the beginning of the week and then higher at the end of the week. Go figure. Nevertheless, the Gold SPDR (GLD) remains in a medium-term downtrend since early October and a short-term downtrend since late November. A falling channel is taking shape with the upper trend line and early December high marking a resistance zone. A break above 167 is needed to fully reverse the short-term downtrend.
**************************************************************************
Key Reports and Events:
Wed - Dec 12 - 07:00 - MBA Mortgage Index
Wed - Dec 12 - 10:30 - Oil Inventories
Wed - Dec 12 - 12:30 - FOMC Rate Decision
Thu - Dec 13 - 08:30 - Jobless Claims
Thu - Dec 13 - 08:30 - Retail Sales
Thu - Dec 13 - 08:30 – Producer Price Index (PPI)
Fri - Dec 14 - 08:30 – Consumer Price Index (CPI)
Fri - Dec 14 - 09:15 - Industrial Production/Capacity Utilization
Charts of Interest: Tuesday and Thursday
This commentary and charts-of-interest are designed to stimulate thinking. This analysis is not a recommendation to buy, sell, hold or sell short any security (stock ETF or otherwise). We all need to think for ourselves when it comes to trading our own accounts. First, it is the only way to really learn. Second, we are the only ones responsible for our decisions. Think of these charts as food for further analysis. Before making a trade, it is important to have a plan. Plan the trade and trade the plan. Among other things, this includes setting a trigger level, a target area and a stop-loss level. It is also important to plan for three possible price movements: advance, decline or sideways. Have a plan for all three scenarios BEFORE making the trade. Consider possible holding times. And finally, look at overall market conditions and sector/industry performance.


**************************************************************************
The 20+ Year T-Bond ETF (TLT) got a smack-down after the better-than-expected jobs report on Friday. TLT broke resistance mid week and then moved back below this breakout on Friday. TLT is, however, still above its mid November low and still in a slight uptrend the last few weeks. A move below 123.5 would break support and fully reverse this slight uptrend. Such a move would be bullish for stocks. Treasuries will be on the hot seat again this week as the Fed meets.

**************************************************************************
The Dollar got a boost from the jobs report because it put less pressure on the Fed for quantitative easing. It did not, however, totally excuse the Fed from quantitative easing because Washington DC has been impotent on the fiscal side of the equation. The US Dollar Fund (UUP) broke resistance with a surge above 21.95 late last week and this breakout is holding so far. A quick move below 21.85 would throw cold water on the breakout.

**************************************************************************
The US Oil Fund (USO) continues to be range bound since late October. The swings within this range hit resistance near 33 and find support near 31.25. The pattern since late October looks like a rising flag on the daily chart and a break below 31.25 would signal a continuation lower. The swing within this consolidation is down with the Raff Regression Channel and a buffer marking first resistance at 32.

**************************************************************************
Gold followed the Dollar as both moved lower at the beginning of the week and then higher at the end of the week. Go figure. Nevertheless, the Gold SPDR (GLD) remains in a medium-term downtrend since early October and a short-term downtrend since late November. A falling channel is taking shape with the upper trend line and early December high marking a resistance zone. A break above 167 is needed to fully reverse the short-term downtrend.

**************************************************************************
Key Reports and Events:
Wed - Dec 12 - 07:00 - MBA Mortgage Index
Wed - Dec 12 - 10:30 - Oil Inventories
Wed - Dec 12 - 12:30 - FOMC Rate Decision
Thu - Dec 13 - 08:30 - Jobless Claims
Thu - Dec 13 - 08:30 - Retail Sales
Thu - Dec 13 - 08:30 – Producer Price Index (PPI)
Fri - Dec 14 - 08:30 – Consumer Price Index (CPI)
Fri - Dec 14 - 09:15 - Industrial Production/Capacity Utilization
Charts of Interest: Tuesday and Thursday
This commentary and charts-of-interest are designed to stimulate thinking. This analysis is not a recommendation to buy, sell, hold or sell short any security (stock ETF or otherwise). We all need to think for ourselves when it comes to trading our own accounts. First, it is the only way to really learn. Second, we are the only ones responsible for our decisions. Think of these charts as food for further analysis. Before making a trade, it is important to have a plan. Plan the trade and trade the plan. Among other things, this includes setting a trigger level, a target area and a stop-loss level. It is also important to plan for three possible price movements: advance, decline or sideways. Have a plan for all three scenarios BEFORE making the trade. Consider possible holding times. And finally, look at overall market conditions and sector/industry performance.

About the author:
Arthur Hill, CMT, is the Chief Technical Strategist at TrendInvestorPro.com. Focusing predominantly on US equities and ETFs, his systematic approach of identifying trend, finding signals within the trend, and setting key price levels has made him an esteemed market technician. Arthur has written articles for numerous financial publications including Barrons and Stocks & Commodities Magazine. In addition to his Chartered Market Technician (CMT) designation, he holds an MBA from the Cass Business School at City University in London.
Learn More


