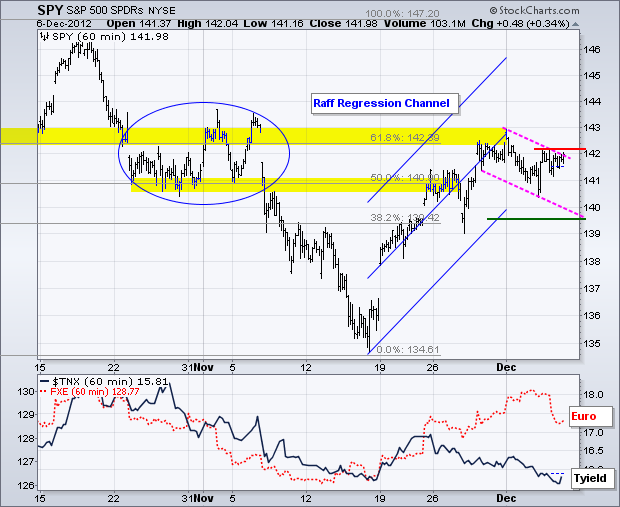
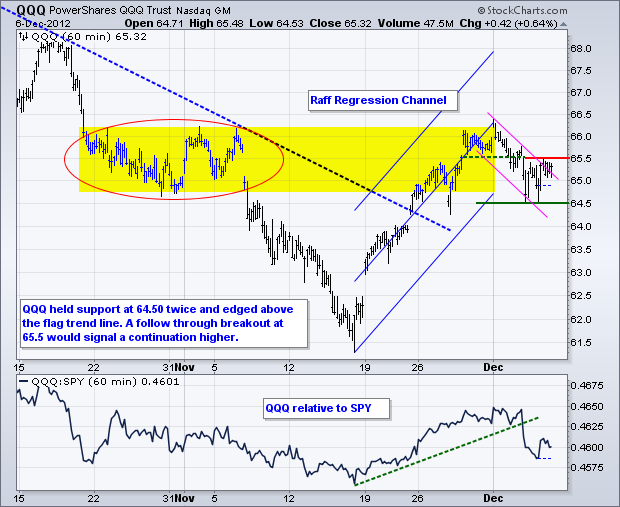
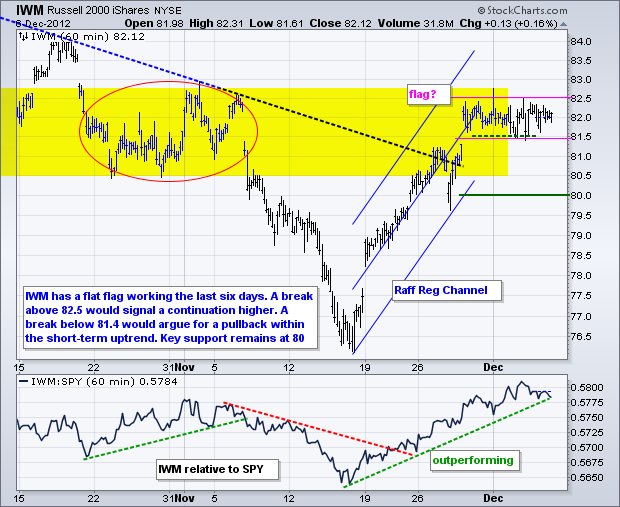
Stocks will simply not give up the bid or the hope of a fiscal cliff solution. The major index ETFs became short-term oversold last week and pretty much consolidated this week. The Russell 2000 ETF (IWM) and the S&P MidCap 400 SPDR (MDY) held up the best with flat consolidations. These two show relative strength and could lead on any breakout. The Nasdaq 100 ETF (QQQ) fared the worst as weakness in Apple weighed on the ETF. It is now time for the employment report. Given all the fiscal cliff hype, I am not sure how much this will affect the market. A really strong report would be bullish for stocks and bearish for bonds. Conversely, a weak report would have the opposite affect. On the 60-minute chart, the S&P 500 ETF (SPY) consolidated near the upper end of it falling flag. A break out at 142.10 would be bullish and signal a continuation of the short-term uptrend. Key support remains at 139.50 for now.

**************************************************************************
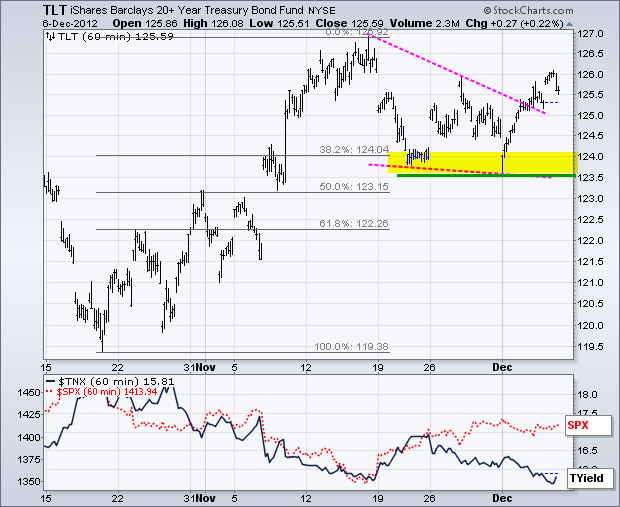
The 20+ Year T-Bond ETF (TLT) opened weak on Monday and then rallied with a move from 123.5 to 126 (low to high). This is a pretty big move for treasuries and creates a short-term overbought situation. TLT broke wedge resistance and held above this breakout on Thursday. Friday's employment report marks a moment-of-truth for TLT.
**************************************************************************
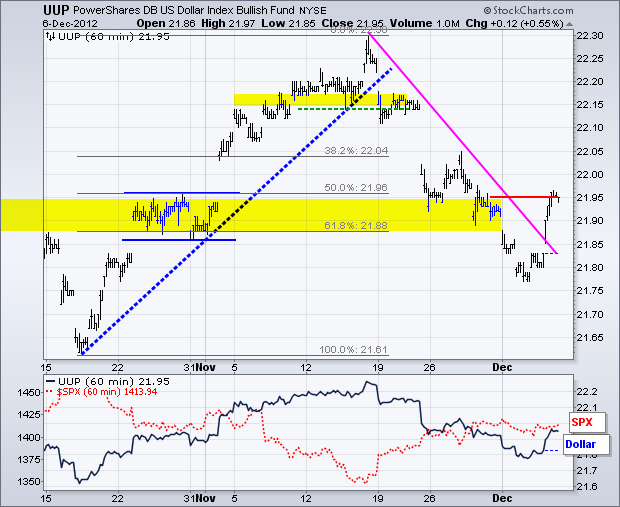
The European Central Bank (ECB) cut its growth and inflation forecast and Mario Draghi kept a rate cut on the table. This pushed the Euro lower and the Dollar higher. On the chart, the US Dollar Fund (UUP) surged to resistance at 21.95 and stalled in the afternoon. This could be a one-day oversold bounce so we need some follow through to confirm a short-term trend reversal. The Dollar will take center stage on Friday with the employment report. My guess is that a better-than-expected number would be Dollar bullish, while a worse-than-expected report would be Dollar bearish.
**************************************************************************
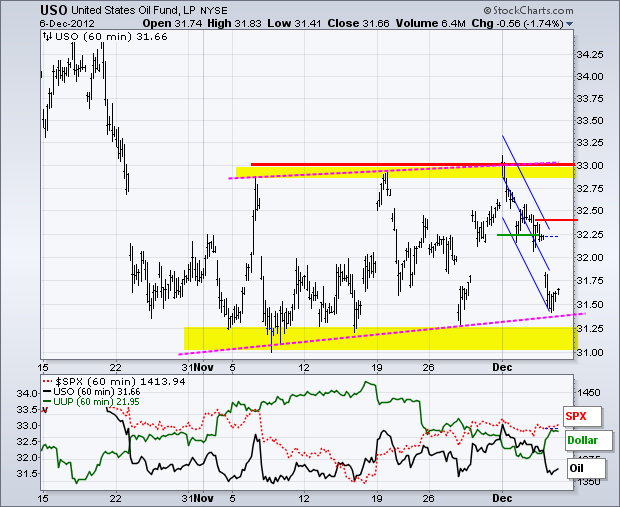
The US Oil Fund (USO) continues to bounce between support and resistance within the consolidation. The ETF failed at 33 on Monday and plunged towards the support zone over the last four days. The swing within this range is down with resistance marked at 32.40.
**************************************************************************
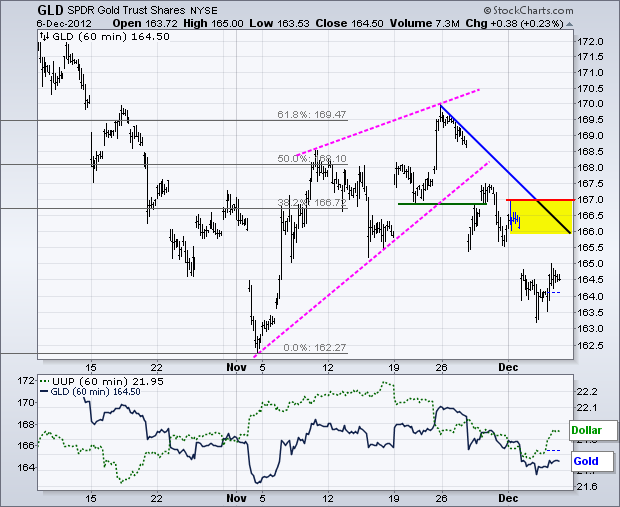
The Dollar surged and gold move higher. Go figure. The Gold SPDR (GLD) finally got a bounce with a move to 164.50 on Thursday. The short-term trend is clearly down with resistance marked in the 166-167 zone. The late November trend line and this week's high combine to mark resistance here.
**************************************************************************
Key Reports and Events:
Thu - Dec 06 - 07:30 - Challenger Job Cuts
Thu - Dec 06 - 08:30 - Jobless Claims
Fri - Dec 07 - 08:30 - Employment Report
Fri - Dec 07 - 09:55 - Michigan Sentiment
Charts of Interest: Tuesday and Thursday
This commentary and charts-of-interest are designed to stimulate thinking. This analysis is not a recommendation to buy, sell, hold or sell short any security (stock ETF or otherwise). We all need to think for ourselves when it comes to trading our own accounts. First, it is the only way to really learn. Second, we are the only ones responsible for our decisions. Think of these charts as food for further analysis. Before making a trade, it is important to have a plan. Plan the trade and trade the plan. Among other things, this includes setting a trigger level, a target area and a stop-loss level. It is also important to plan for three possible price movements: advance, decline or sideways. Have a plan for all three scenarios BEFORE making the trade. Consider possible holding times. And finally, look at overall market conditions and sector/industry performance.

**************************************************************************
The European Central Bank (ECB) cut its growth and inflation forecast and Mario Draghi kept a rate cut on the table. This pushed the Euro lower and the Dollar higher. On the chart, the US Dollar Fund (UUP) surged to resistance at 21.95 and stalled in the afternoon. This could be a one-day oversold bounce so we need some follow through to confirm a short-term trend reversal. The Dollar will take center stage on Friday with the employment report. My guess is that a better-than-expected number would be Dollar bullish, while a worse-than-expected report would be Dollar bearish.

**************************************************************************
The US Oil Fund (USO) continues to bounce between support and resistance within the consolidation. The ETF failed at 33 on Monday and plunged towards the support zone over the last four days. The swing within this range is down with resistance marked at 32.40.

**************************************************************************
The Dollar surged and gold move higher. Go figure. The Gold SPDR (GLD) finally got a bounce with a move to 164.50 on Thursday. The short-term trend is clearly down with resistance marked in the 166-167 zone. The late November trend line and this week's high combine to mark resistance here.

**************************************************************************
Key Reports and Events:
Thu - Dec 06 - 07:30 - Challenger Job Cuts
Thu - Dec 06 - 08:30 - Jobless Claims
Fri - Dec 07 - 08:30 - Employment Report
Fri - Dec 07 - 09:55 - Michigan Sentiment
Charts of Interest: Tuesday and Thursday
This commentary and charts-of-interest are designed to stimulate thinking. This analysis is not a recommendation to buy, sell, hold or sell short any security (stock ETF or otherwise). We all need to think for ourselves when it comes to trading our own accounts. First, it is the only way to really learn. Second, we are the only ones responsible for our decisions. Think of these charts as food for further analysis. Before making a trade, it is important to have a plan. Plan the trade and trade the plan. Among other things, this includes setting a trigger level, a target area and a stop-loss level. It is also important to plan for three possible price movements: advance, decline or sideways. Have a plan for all three scenarios BEFORE making the trade. Consider possible holding times. And finally, look at overall market conditions and sector/industry performance.

About the author:
Arthur Hill, CMT, is the Chief Technical Strategist at TrendInvestorPro.com. Focusing predominantly on US equities and ETFs, his systematic approach of identifying trend, finding signals within the trend, and setting key price levels has made him an esteemed market technician. Arthur has written articles for numerous financial publications including Barrons and Stocks & Commodities Magazine. In addition to his Chartered Market Technician (CMT) designation, he holds an MBA from the Cass Business School at City University in London.
Learn More


