Programming note: I will be taking off December 27th and 31st. Art's charts and the Market Message will be updated on Wednesday and Friday this week, and Wednesday (Jan-2) next week. Happy Holidays!
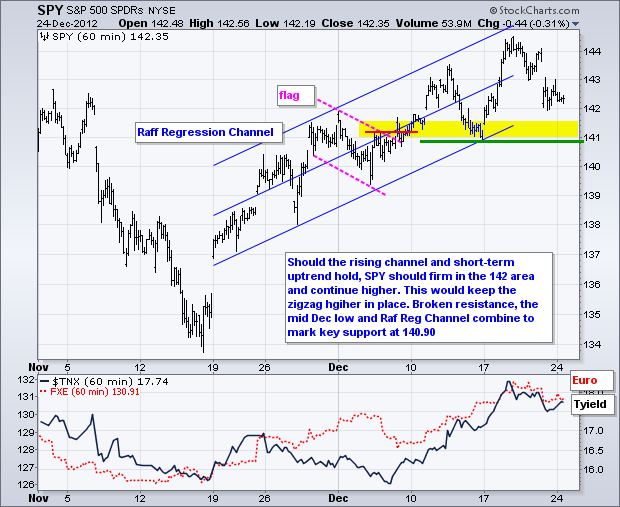
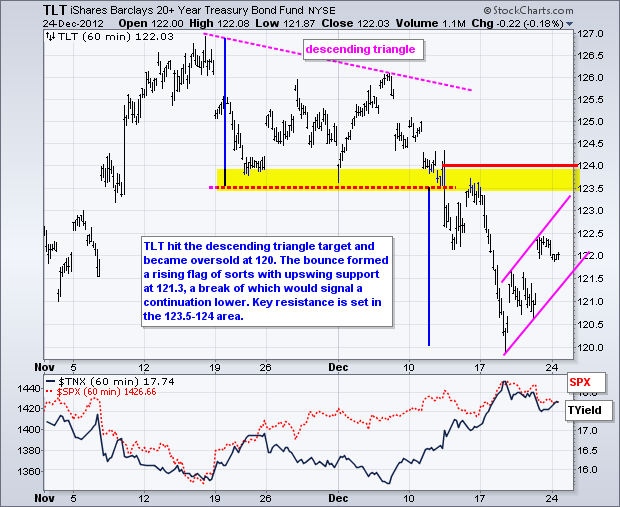
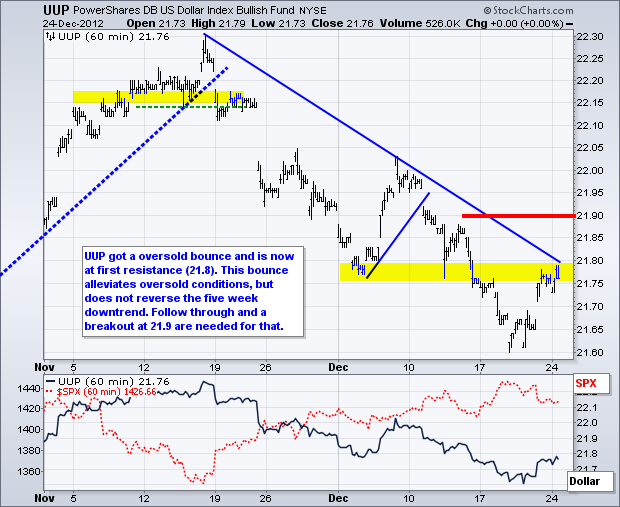
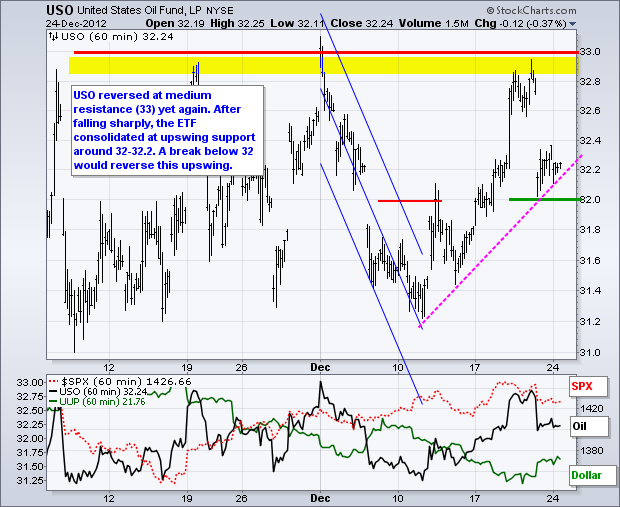
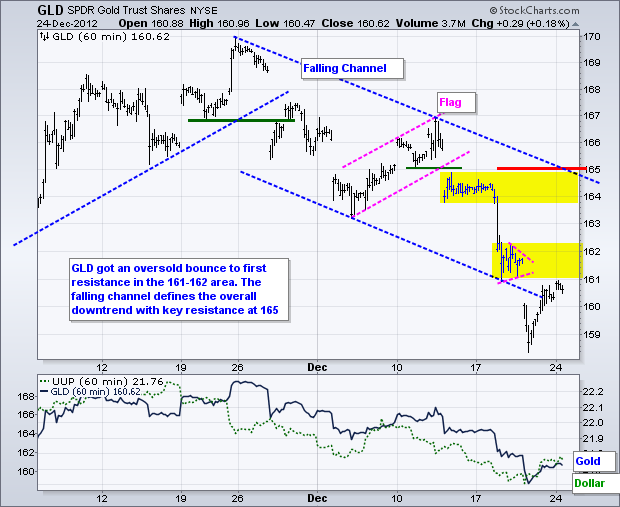
Stocks edged lower on Christmas Eve with relatively mild selling pressure during a shortened session. The markets are open the next four days and will end the year with a full session on December 31st. Congress and the President return to Washington on Thursday for more haggling on the fiscal cliff. With trading volume light the next few days, the markets could be extra volatile as new bites trigger knee-jerk reactions. So much for a nice and dull trading week as we reach yearend. The major index ETFs remain in short-term uptrend and the intermarket dynamics are bullish. Stocks, oil and the Euro advanced the last two weeks, while the Dollar, gold and Treasuries fell. Treasuries and the Dollar got oversold bounces the last few days, but the overall trends remain down and this is favorable for stocks.
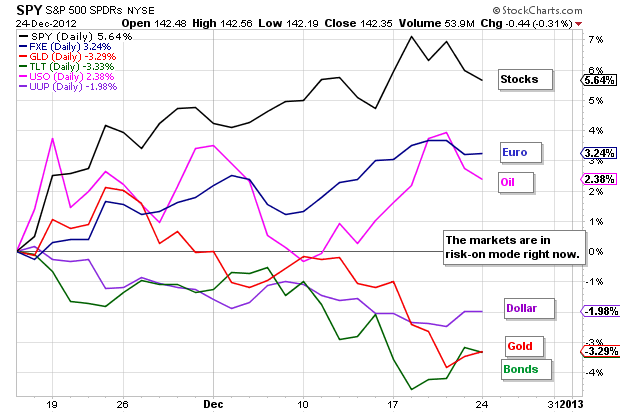
Stocks edged lower on Christmas Eve with relatively mild selling pressure during a shortened session. The markets are open the next four days and will end the year with a full session on December 31st. Congress and the President return to Washington on Thursday for more haggling on the fiscal cliff. With trading volume light the next few days, the markets could be extra volatile as new bites trigger knee-jerk reactions. So much for a nice and dull trading week as we reach yearend. The major index ETFs remain in short-term uptrend and the intermarket dynamics are bullish. Stocks, oil and the Euro advanced the last two weeks, while the Dollar, gold and Treasuries fell. Treasuries and the Dollar got oversold bounces the last few days, but the overall trends remain down and this is favorable for stocks.

**************************************************************************
**************************************************************************
**************************************************************************
**************************************************************************
**************************************************************************
Key Reports and Events:
Wed - Dec 26 - 07:00 - MBA Mortgage Index
Wed - Dec 26 - 09:00 - Case-Shiller 20-city Index
Thu – Dec 27 – 08:00 – President and Congress Return
Thu - Dec 27 - 08:30 - Jobless Claims
Thu - Dec 27 - 10:00 - New Home Sales
Thu - Dec 27 - 10:00 - Consumer Confidence
Fri - Dec 28 - 09:45 - Chicago PMI
Fri - Dec 28 - 10:00 - Pending Home Sales
Fri - Dec 28 - 11:00 - Oil Inventories
Charts of Interest: Tuesday and Thursday
This commentary and charts-of-interest are designed to stimulate thinking. This analysis is not a recommendation to buy, sell, hold or sell short any security (stock ETF or otherwise). We all need to think for ourselves when it comes to trading our own accounts. First, it is the only way to really learn. Second, we are the only ones responsible for our decisions. Think of these charts as food for further analysis. Before making a trade, it is important to have a plan. Plan the trade and trade the plan. Among other things, this includes setting a trigger level, a target area and a stop-loss level. It is also important to plan for three possible price movements: advance, decline or sideways. Have a plan for all three scenarios BEFORE making the trade. Consider possible holding times. And finally, look at overall market conditions and sector/industry performance.

About the author:
Arthur Hill, CMT, is the Chief Technical Strategist at TrendInvestorPro.com. Focusing predominantly on US equities and ETFs, his systematic approach of identifying trend, finding signals within the trend, and setting key price levels has made him an esteemed market technician. Arthur has written articles for numerous financial publications including Barrons and Stocks & Commodities Magazine. In addition to his Chartered Market Technician (CMT) designation, he holds an MBA from the Cass Business School at City University in London.
Learn More


