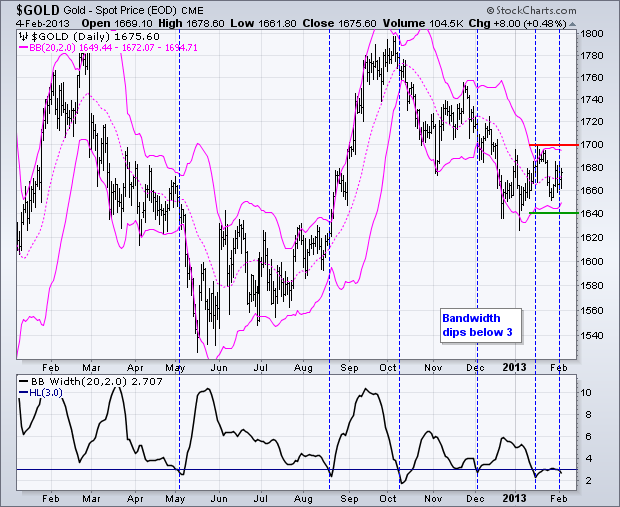
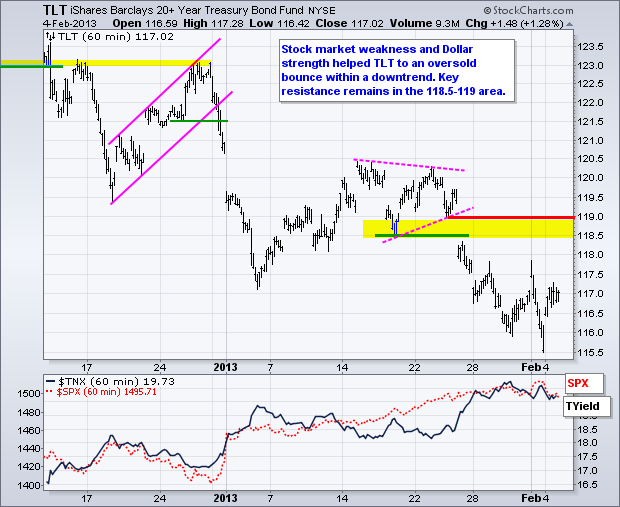
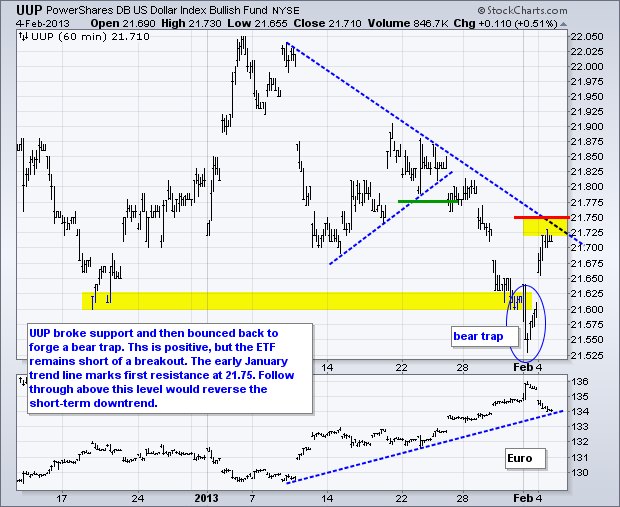
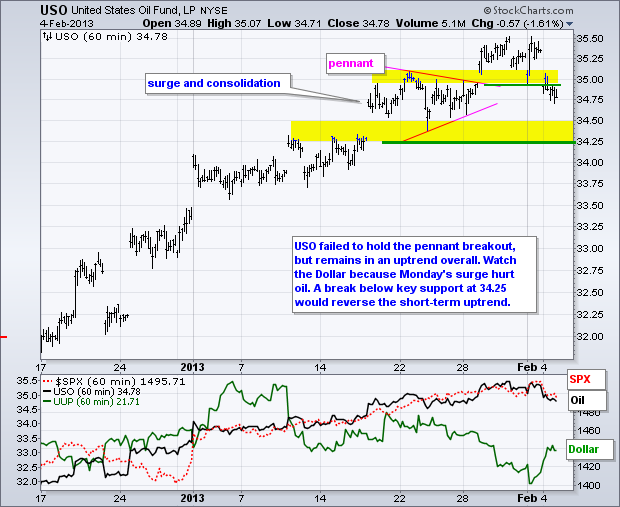
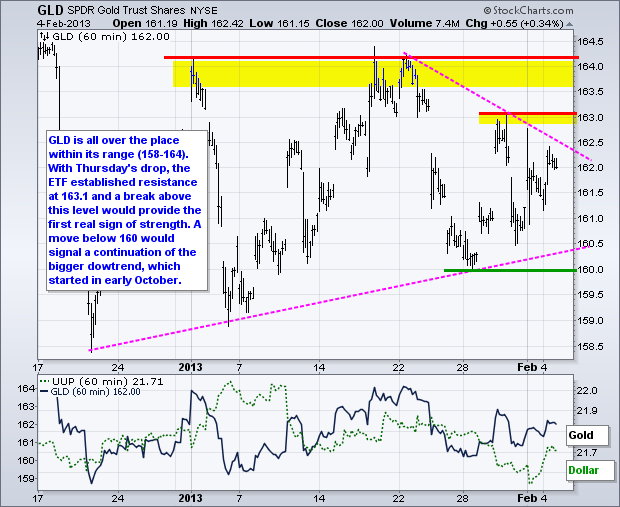
Although European issues got the blame for Monday's stock market decline, weakness should not come as a surprise because stocks were quite overbought and ripe for a corrective period. In addition to overbought conditions, two historical tendencies came into play on the second trading day of the month. First, the first day of the month, which was Friday, has a strong positive bias and the Dow surged 150 points to end the week. This positive first day bias does not extend to the second day. Second, February is the second worst performing month since 1970 with an average gain of .09%. Even though a positive January bodes well for the rest of the year, a February rest may be needed to rejuvenate stocks for the next leg higher. The markets took risk off the table on Monday with stocks, oil and the Euro moving lower. Conversely, the Dollar and Treasuries moved higher. Gold also acted as a risk-off asset with a modest advance on Monday. The chart below shows Spot Gold ($GOLD) with the Bollinger Bands narrowing over the last few weeks. Notice that gold seems to make a move when BandWidth dips below 3 (blue dotted line). Gold hit resistance near 1700 in January and needs to break this level to reverse the overall downtrend. Support is set at 1640 and a break below would target a move towards the May-July lows (1540-1560).

**************************************************************************
**************************************************************************
**************************************************************************
**************************************************************************
**************************************************************************
Key Reports and Events:
Mon - Feb 04 - 10:00 - Factory Orders
Tue - Feb 05 - 10:00 - ISM Services
Wed - Feb 06 - 07:00 - MBA Mortgage Index
Wed - Feb 06 - 10:30 - Oil Inventories
Thu - Feb 07 - 08:30 - Jobless Claims
Thu - Feb 07 - 10:30 - Natural Gas Inventories
Fri – Mar 01 - 23:59 – Sequester Takes Effect
Wed – Mar 27 - 23:59 – Government Shut Down Deadline
Wed – May 15 - 23:59 – New Debt Ceiling Deadline
Charts of Interest: Tuesday and Thursday
This commentary and charts-of-interest are designed to stimulate thinking. This analysis is
not a recommendation to buy, sell, hold or sell short any security (stock ETF or otherwise).
We all need to think for ourselves when it comes to trading our own accounts. First, it is
the only way to really learn. Second, we are the only ones responsible for our decisions.
Think of these charts as food for further analysis. Before making a trade, it is important
to have a plan. Plan the trade and trade the plan. Among other things, this includes setting
a trigger level, a target area and a stop-loss level. It is also important to plan for three
possible price movements: advance, decline or sideways. Have a plan for all three scenarios
BEFORE making the trade. Consider possible holding times. And finally, look at overall market
conditions and sector/industry performance.

About the author:
Arthur Hill, CMT, is the Chief Technical Strategist at TrendInvestorPro.com. Focusing predominantly on US equities and ETFs, his systematic approach of identifying trend, finding signals within the trend, and setting key price levels has made him an esteemed market technician. Arthur has written articles for numerous financial publications including Barrons and Stocks & Commodities Magazine. In addition to his Chartered Market Technician (CMT) designation, he holds an MBA from the Cass Business School at City University in London.
Learn More


