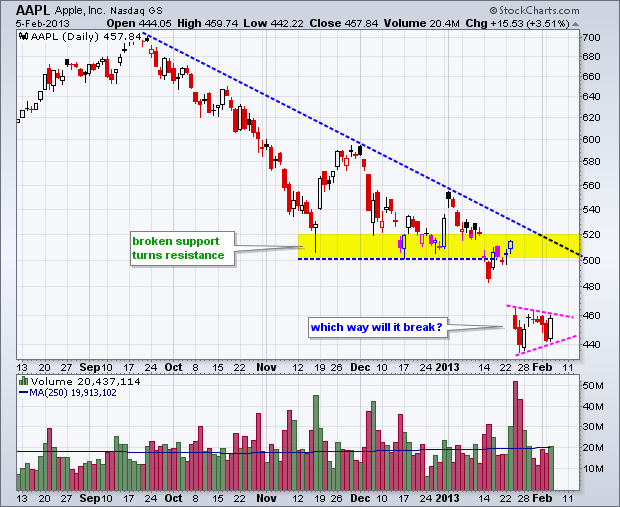
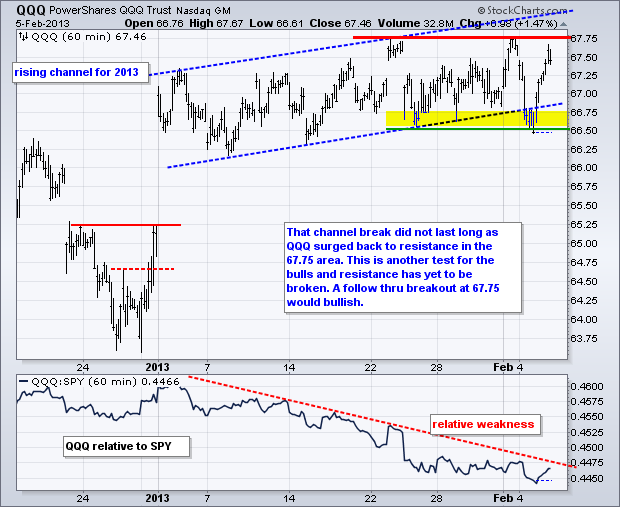
Stocks rebounded with a big bang as the Nasdaq 100 ETF (QQQ) led the market higher. Yes, you read right. Microsoft, Intel, Cisco, and Dell all gained on the day and were on the most active list. Could the Dell LBO revive the old Winteldell machine? We shall see. Gains were not limited to big techs as all sectors move higher. The finance, consumer staples and healthcare sectors all gained around 1%. Aerospace and Defense stocks bounced on news of a possible delay in sequester. The stock market just loves these kick-the-can-down-the-road solutions. Even Apple got into the mix on Tuesday with a 3.51% gain and bounce off support in the 440 area. APPL still holds an important key to the Q's. As the chart below shows, the stock formed a pennant over the last two weeks. A break above 460 would be positive and could trigger a bounce back to broken support in the 500-520 area. A break below 440 would be bearish, however, and signal a continuation lower. As Apple goes so goes QQQ.

**************************************************************************
**************************************************************************
**************************************************************************
**************************************************************************
**************************************************************************
Key Reports and Events:
Wed - Feb 06 - 07:00 - MBA Mortgage Index
Wed - Feb 06 - 10:30 - Oil Inventories
Thu - Feb 07 - 08:30 - Jobless Claims
Thu - Feb 07 - 10:30 - Natural Gas Inventories
Fri – Mar 01 - 23:59 – Sequester Takes Effect
Wed – Mar 27 - 23:59 – Government Shut Down Deadline
Wed – May 15 - 23:59 – New Debt Ceiling Deadline
Charts of Interest: Tuesday and Thursday
This commentary and charts-of-interest are designed to stimulate thinking. This analysis is
not a recommendation to buy, sell, hold or sell short any security (stock ETF or otherwise).
We all need to think for ourselves when it comes to trading our own accounts. First, it is
the only way to really learn. Second, we are the only ones responsible for our decisions.
Think of these charts as food for further analysis. Before making a trade, it is important
to have a plan. Plan the trade and trade the plan. Among other things, this includes setting
a trigger level, a target area and a stop-loss level. It is also important to plan for three
possible price movements: advance, decline or sideways. Have a plan for all three scenarios
BEFORE making the trade. Consider possible holding times. And finally, look at overall market
conditions and sector/industry performance.

About the author:
Arthur Hill, CMT, is the Chief Technical Strategist at TrendInvestorPro.com. Focusing predominantly on US equities and ETFs, his systematic approach of identifying trend, finding signals within the trend, and setting key price levels has made him an esteemed market technician. Arthur has written articles for numerous financial publications including Barrons and Stocks & Commodities Magazine. In addition to his Chartered Market Technician (CMT) designation, he holds an MBA from the Cass Business School at City University in London.
Learn More


