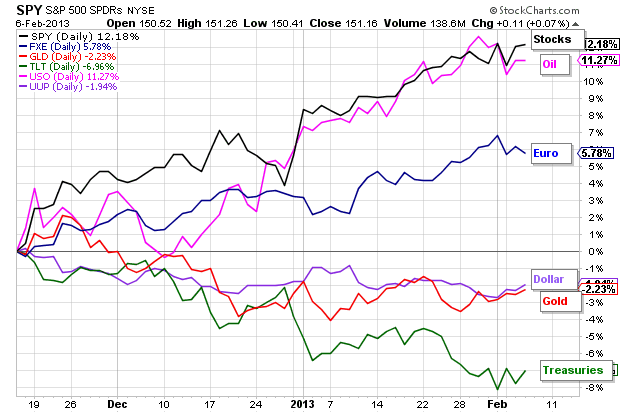
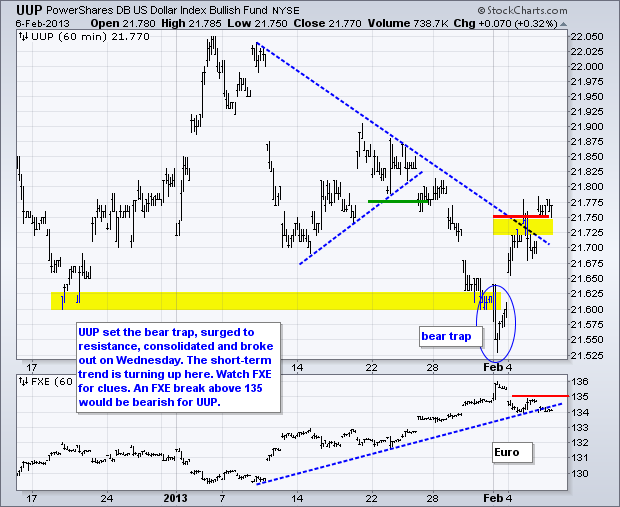
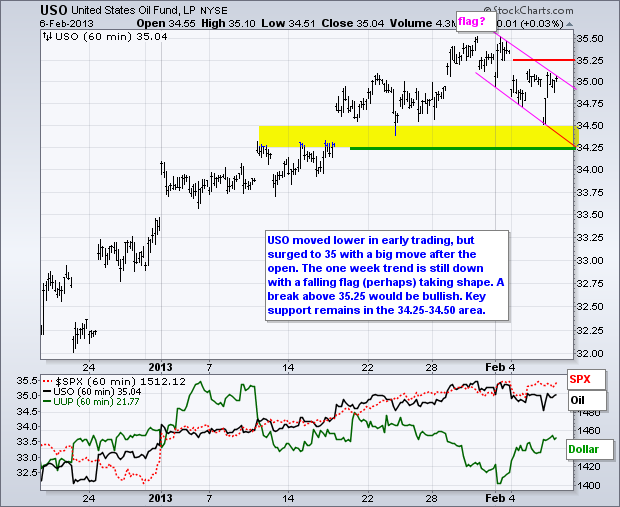
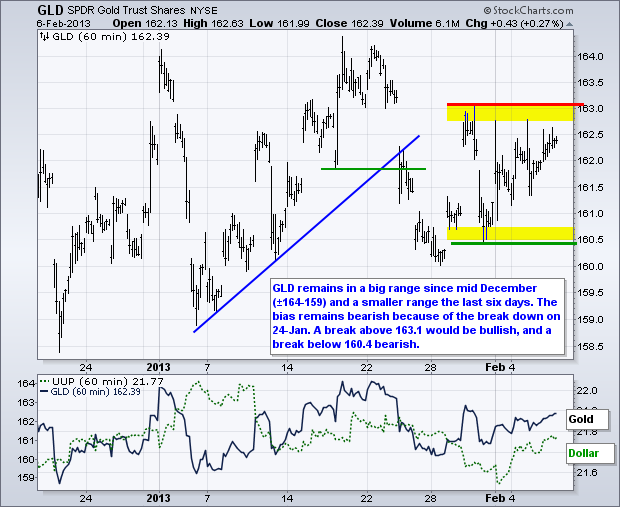
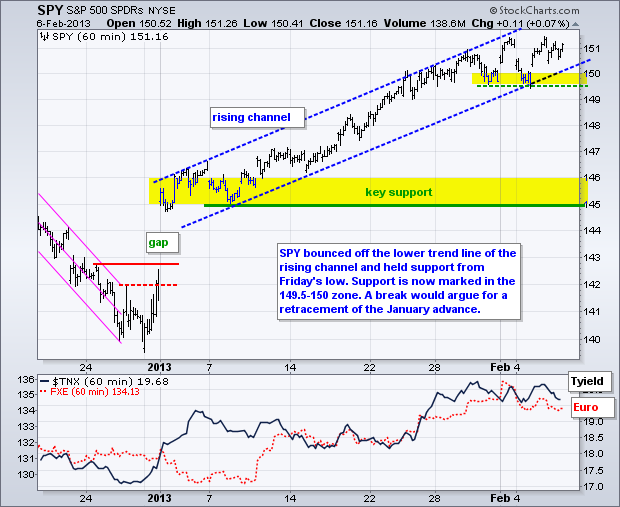
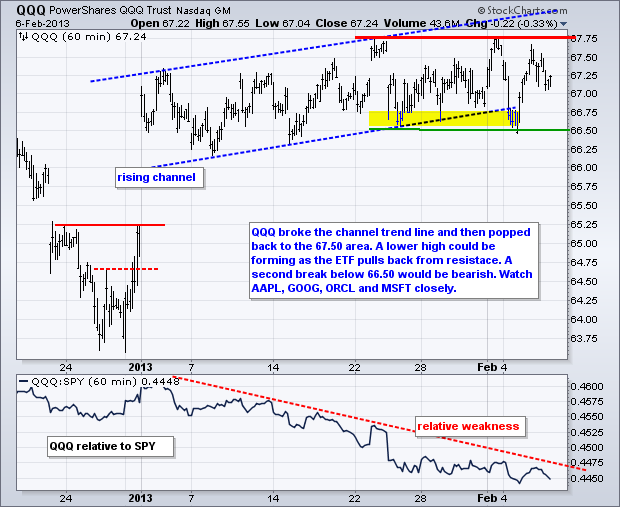
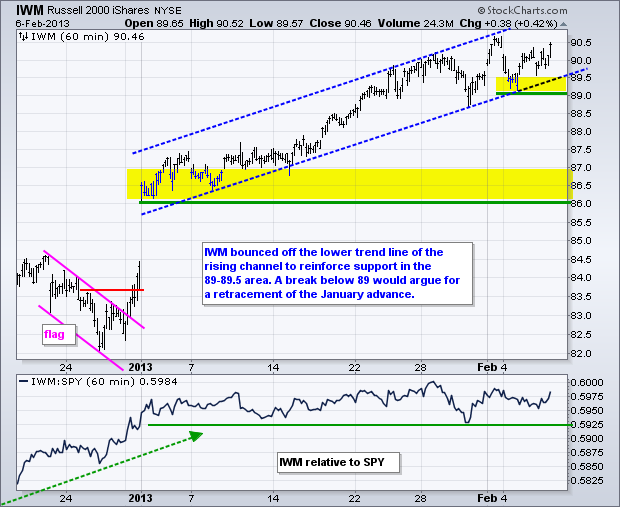
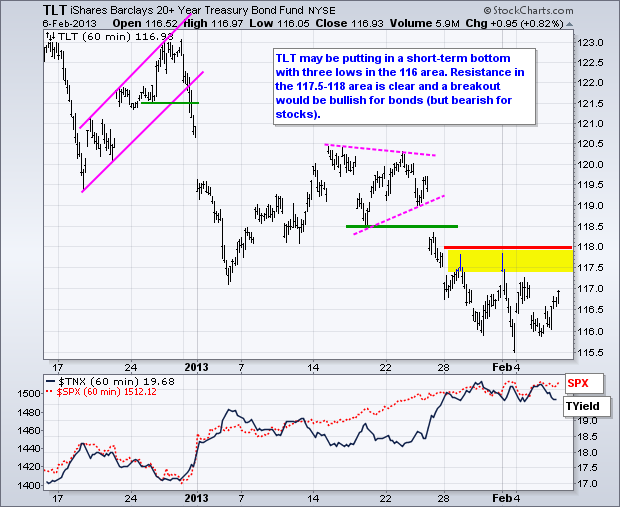
Stocks were mixed on Wednesday as the Nasdaq 100 ETF (QQQ) edged lower and the S&P 500 ETF (SPY) edged higher. Trading was seriously subdued in the sector SPDRs. Utilities SPDR (XLU) provided the biggest advance (.30%), while the Technology SPDR (XLK) provided the biggest loss (.03%). These are some seriously tiny moves. Steel provided one of the few sparks on the day as the Steel ETF (SLX) gained 1.52%. Strength in steel stocks also helped the Metals & Mining SPDR (XME) to a 1.97% gain. As noted in Wednesday's market message, I am not ready to turn bullish on these two because they remain short of breakouts and show relative weakness since early January. Focus may turn to Treasuries and the Euro over the next few days. The 20+ Year T-Bond ETF (TLT) is basing somewhat and a breakout would be short-term bullish. Such a move would be bearish for stocks. The Euro Currency Trust (FXE) broke short-term support and this triggered a breakout in the US Dollar Fund (UUP). A breakout in TLT and continued strength in UUP would be negative for an overbought stock market.
**************************************************************************
**************************************************************************
**************************************************************************
**************************************************************************
**************************************************************************
Key Reports and Events:
Thu - Feb 07 - 08:30 - Jobless Claims
Thu - Feb 07 - 10:30 - Natural Gas Inventories
Fri – Mar 01 - 23:59 – Sequester Takes Effect
Wed – Mar 27 - 23:59 – Government Shut Down Deadline
Wed – May 15 - 23:59 – New Debt Ceiling Deadline
Charts of Interest: Tuesday and Thursday
This commentary and charts-of-interest are designed to stimulate thinking. This analysis is
not a recommendation to buy, sell, hold or sell short any security (stock ETF or otherwise).
We all need to think for ourselves when it comes to trading our own accounts. First, it is
the only way to really learn. Second, we are the only ones responsible for our decisions.
Think of these charts as food for further analysis. Before making a trade, it is important
to have a plan. Plan the trade and trade the plan. Among other things, this includes setting
a trigger level, a target area and a stop-loss level. It is also important to plan for three
possible price movements: advance, decline or sideways. Have a plan for all three scenarios
BEFORE making the trade. Consider possible holding times. And finally, look at overall market
conditions and sector/industry performance.

