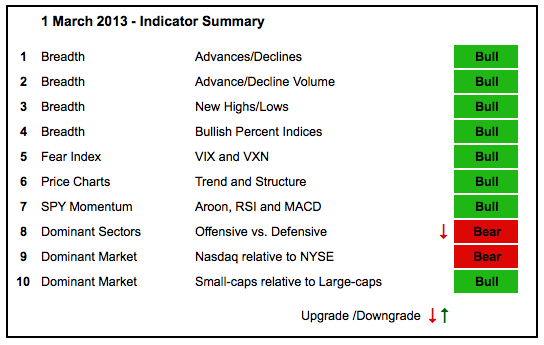
The majority of indicators remain bullish, but offensive sector performance got a downtrend. The technology and consumer discretionary sectors underperformed in February, but the finance and industrials sectors outperformed. In addition, note that the defensive sectors outperformed in February. This combination points to risk-aversion in the stock market. The SPY momentum indicators are also teetering on the verge of turning bearish. This group is usually the first to break down when the trend changes. In particular, a move below -50 in the Aroon Oscillator would be negative for SPY.
- AD Lines: Bullish. After a big surge from mid November to mid February, the Nasdaq AD Line pulled back the last two weeks, but has yet to reverse its uptrend. The NYSE AD Line hit a new high last week and bounced back towards this high this week. No downtrend here.
- AD Volume Lines: Bullish. The Nasdaq and NYSE AD Volume Lines hit new highs mid month and then fell back. This is just a pullback within an uptrend at this point.
- Net New Highs: Bullish. Net New Highs fell sharply the last two weeks, but we have yet to see new lows exceed new highs and the cumulative lines hit new highs.
- Bullish Percent Indices: Bullish. All nine sector Bullish Percent Indices are above 50%.
- VIX/VXN: Bullish. The S&P 500 Volatility Index ($VIX) and the Nasdaq 100 Volatility Index ($VXN) surged above 19 on Monday, but fell back sharply. A move above 20 would signal a breakout in fear and this would be negative for stocks.
- Trend-Structure: Bullish. DIA hit a new high this week, but the other major index ETFs fell short (IWM, MDY, QQEW and SPY). Even though the bigger trends are up, this non-confirmation could be short-term negative and foreshadow a corrective period.
- SPY Momentum: Bullish. RSI bounced off the 40-50 support zone and MACD (5,35,5) remains positive. Aroon (20) dipped into negative territory, but did not break below -50. Even though momentum is still bullish overall, upside momentum is clearly waning.
- Offensive Sector Performance: Bearish. The Consumer Discretionary SPDR (XLY) and the Nasdaq 100 Equal-Weight ETF (QQEW) showed relative weakness in February. Even though the Finance SPDR (XLF) and the Industrials SPDR (XLI) outperformed the S&P 500 ETF (SPY), the three defensive sectors outperformed these two (XLU, XLP, XLV). QQEW is used as the technology surrogate.
- Nasdaq Performance: Bearish. The $COMPQ:$NYA ratio got a bounced in February, but has been trending lower since early September.
- Small-cap Performance: Bullish. The $RUT:$OEX ratio fell the last two weeks, but has been trending higher since mid November.
- Breadth Charts (here) and Inter-market charts (here) have been updated.

About the author:
Arthur Hill, CMT, is the Chief Technical Strategist at TrendInvestorPro.com. Focusing predominantly on US equities and ETFs, his systematic approach of identifying trend, finding signals within the trend, and setting key price levels has made him an esteemed market technician. Arthur has written articles for numerous financial publications including Barrons and Stocks & Commodities Magazine. In addition to his Chartered Market Technician (CMT) designation, he holds an MBA from the Cass Business School at City University in London.
Learn More


