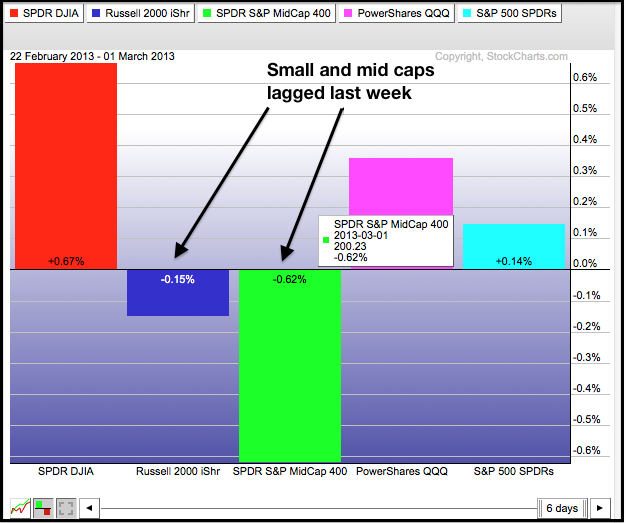
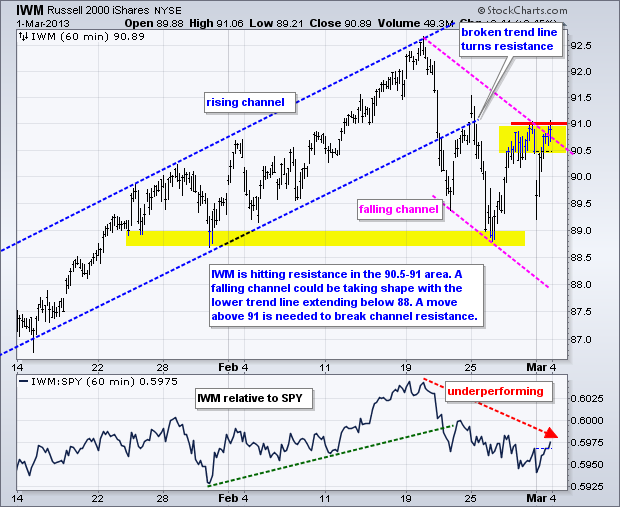
On a closing basis, the Dow SPDR (DIA) closed the week at its highest level in years. Even though Friday's intraday high did not exceed Thursday's intraday high, Friday's close was significant for DIA and the Dow Industrials. Or was it? Of the five major index ETFs, DIA, QQQ and SPY moved higher from Monday to Friday, but IWM and MDY closed lower for the week. It is just one week, but relative weakness in the Russell 2000 ETF (IWM) and S&P Midcap SPDR (MDY) could foreshadow a period of weakness or indecisiveness for the market overall.
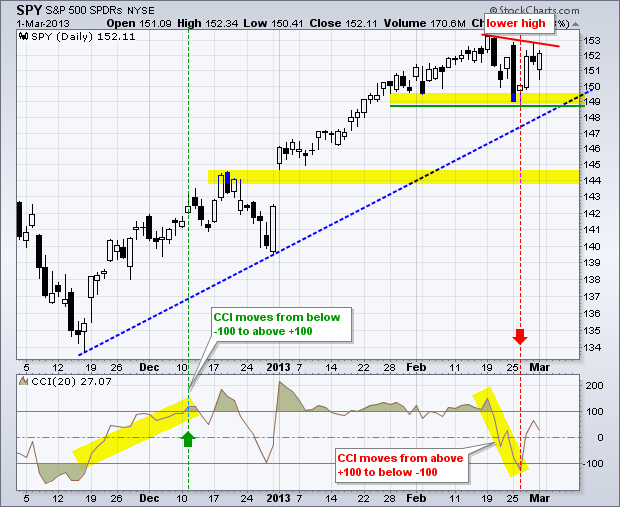
The major index ETFs remain in medium-term uptrends, but it appears that the short-term uptrends reversed with sharp declines on 20-February. Trading turned quite volatile after these "alleged" breakdowns with some pretty big swings the last seven days. The SPY chart below shows medium-term support in the 149 area. Even though support has yet to be broken, a lower high could be forming and CCI plunged below -100 for the first time since mid November.
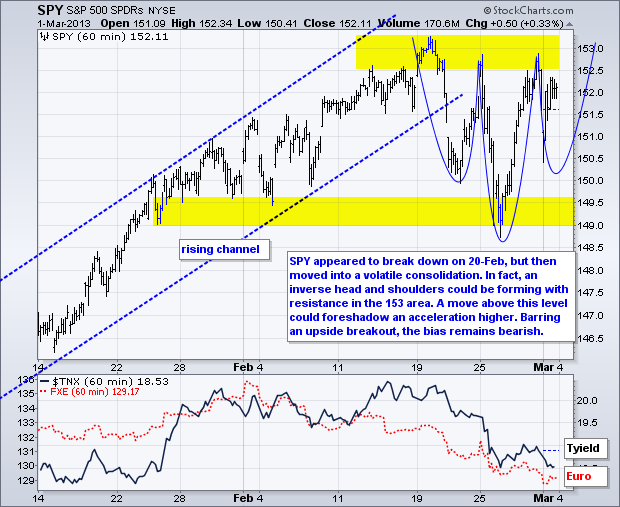
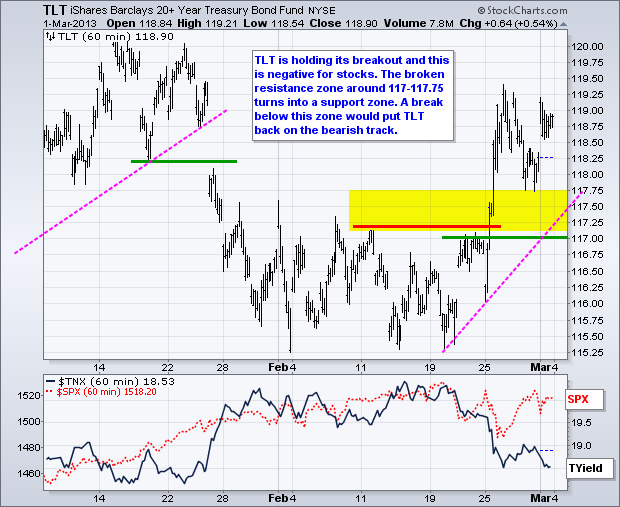
It is a pretty big week on the economic front. We have ISM services on Tuesday, factory orders and the Fed's beige book on Wednesday, jobless claims on Thursday and the big employment report on Friday. This could also be a big week for treasuries, which hold the key to equities. The 20+ Year T-Bond ETF (TLT) broke out on 20-February and this breakout is holding. Stocks are unlikely to continue higher as long as this breakout holds. The TLT chart below marks the first support zone to watch. Also note that SPY may be forming a sloppy inverse head-and-shoulders pattern over the last two weeks.
**************************************************************************
**************************************************************************
**************************************************************************
**************************************************************************
**************************************************************************
Key Reports and Events (all times Eastern):
Tue - Mar 05 - 10:00 - ISM Services
Wed - Mar 06 - 07:00 - MBA Mortgage Index
Wed - Mar 06 - 08:15 - ADP Employment Change
Wed - Mar 06 - 10:00 - Factory Orders
Wed - Mar 06 - 10:30 - Crude Inventories
Wed - Mar 06 - 14:00 - Fed's Beige Book
Thu - Mar 07 - 08:30 - Initial Claims
Thu - Mar 07 - 08:30 - Continuing Claims
Thu - Mar 07 - 10:30 - Natural Gas Inventories
Thu - Mar 07 - 15:00 - Consumer Credit
Fri - Mar 08 - 08:30 - Nonfarm Payrolls
Fri - Mar 08 - 08:30 - Unemployment Rate
Wed – Mar 27 - 23:59 – Government Shut Down Deadline
Wed – May 15 - 23:59 – Debt Ceiling Deadline
Charts of Interest: Tuesday and Thursday
This commentary and charts-of-interest are designed to stimulate thinking. This analysis is
not a recommendation to buy, sell, hold or sell short any security (stock ETF or otherwise).
We all need to think for ourselves when it comes to trading our own accounts. First, it is
the only way to really learn. Second, we are the only ones responsible for our decisions.
Think of these charts as food for further analysis. Before making a trade, it is important
to have a plan. Plan the trade and trade the plan. Among other things, this includes setting
a trigger level, a target area and a stop-loss level. It is also important to plan for three
possible price movements: advance, decline or sideways. Have a plan for all three scenarios
BEFORE making the trade. Consider possible holding times. And finally, look at overall market
conditions and sector/industry performance.

