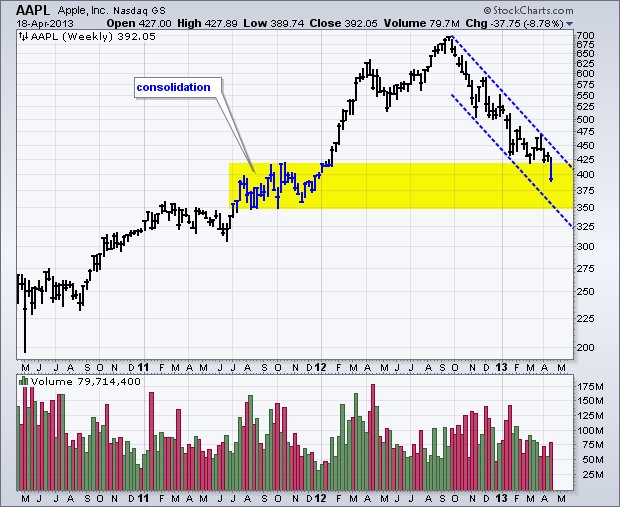
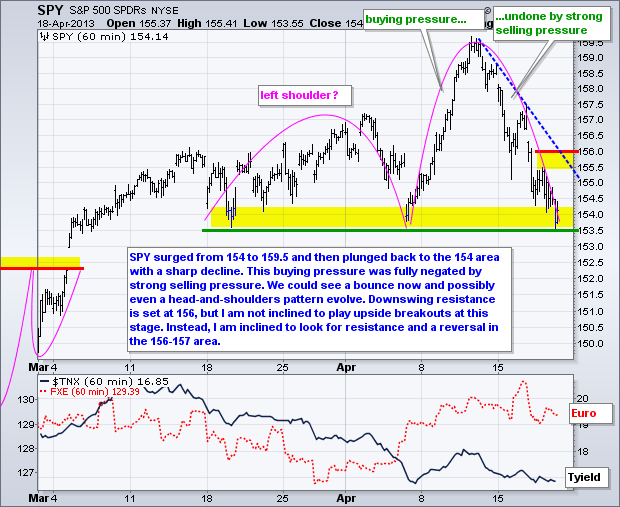
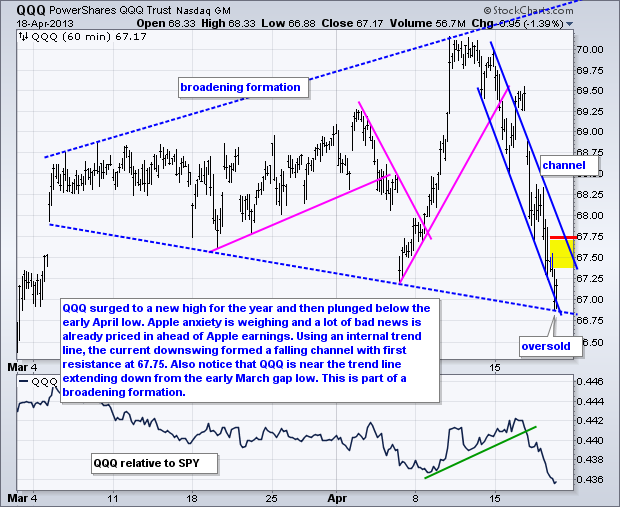
Stocks extended their losses on Thursday with the Nasdaq 100 ETF (QQQ) leading the way lower. Once again, Apple declined and weighed heavily on QQQ. Apple is down over 8% this week and earnings are scheduled next week. As opposed to the S&P 500, which was priced to perfection heading into earnings, Apple is priced for disappointment, which means we could see a buy-the-rumor and sell-the-news or even a positive surprise. On the price chart, notice that Apple has entered a big support zone from the 2011 consolidation. The falling channel defines the seven month downtrend with resistance around 45. A negative reaction to earnings, could push Apple to the lower trend line and bottom of the support zone, which means the 355 area. IBM reported earnings last night and missed. Even though earnings advanced 3% for the quarter, sales actually declined. Rising earnings on falling sales is not a good sign for the broader market or the economy. As Bespoke noted a couple weeks ago, IBM is a true bellwether when it comes to the broader market and the economy.

**************************************************************************
**************************************************************************
**************************************************************************
**************************************************************************
**************************************************************************
Key Reports and Events (all times Eastern):
Fri - Apr 18 - 08:30 - TGIF
Charts of Interest: Tuesday and Thursday
This commentary and charts-of-interest are designed to stimulate thinking. This analysis is
not a recommendation to buy, sell, hold or sell short any security (stock ETF or otherwise).
We all need to think for ourselves when it comes to trading our own accounts. First, it is
the only way to really learn. Second, we are the only ones responsible for our decisions.
Think of these charts as food for further analysis. Before making a trade, it is important
to have a plan. Plan the trade and trade the plan. Among other things, this includes setting
a trigger level, a target area and a stop-loss level. It is also important to plan for three
possible price movements: advance, decline or sideways. Have a plan for all three scenarios
BEFORE making the trade. Consider possible holding times. And finally, look at overall market
conditions and sector/industry performance.

About the author:
Arthur Hill, CMT, is the Chief Technical Strategist at TrendInvestorPro.com. Focusing predominantly on US equities and ETFs, his systematic approach of identifying trend, finding signals within the trend, and setting key price levels has made him an esteemed market technician. Arthur has written articles for numerous financial publications including Barrons and Stocks & Commodities Magazine. In addition to his Chartered Market Technician (CMT) designation, he holds an MBA from the Cass Business School at City University in London.
Learn More