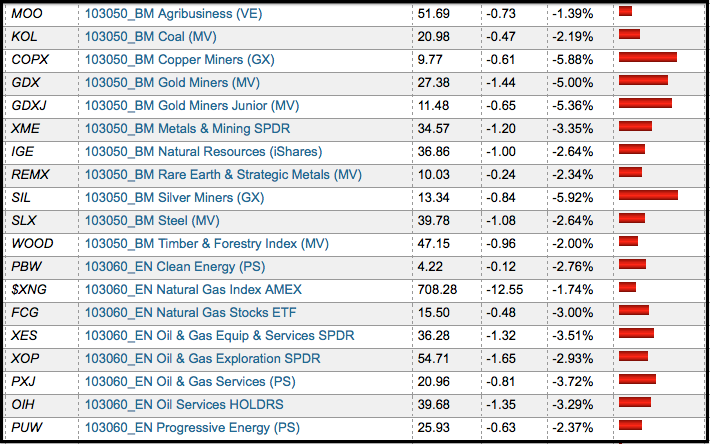
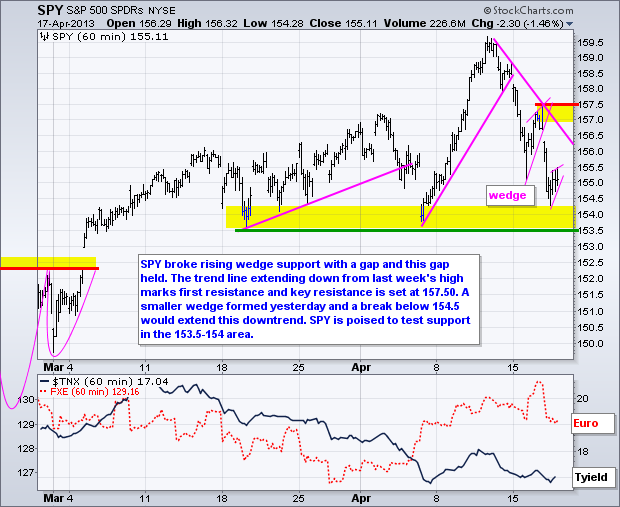
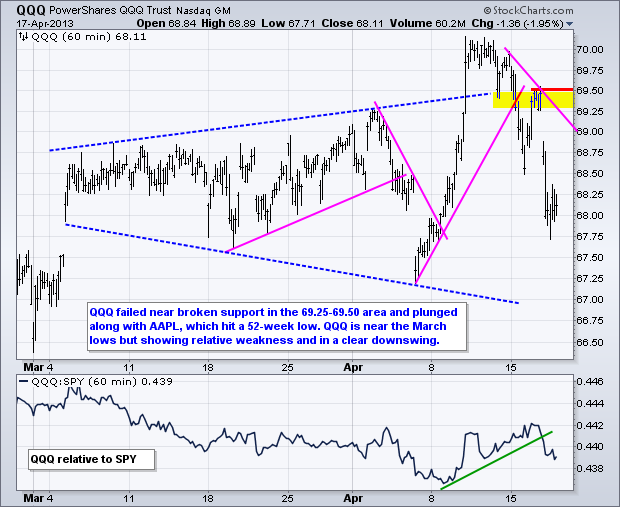
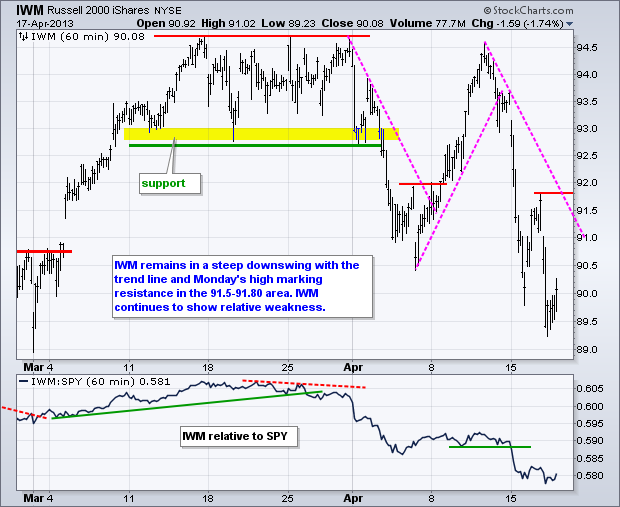
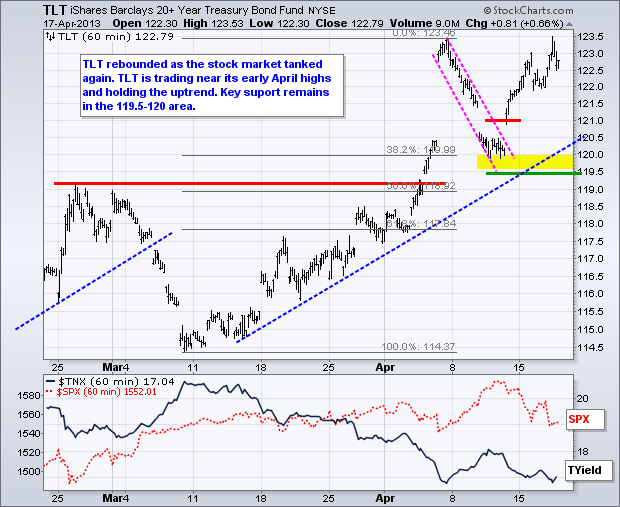
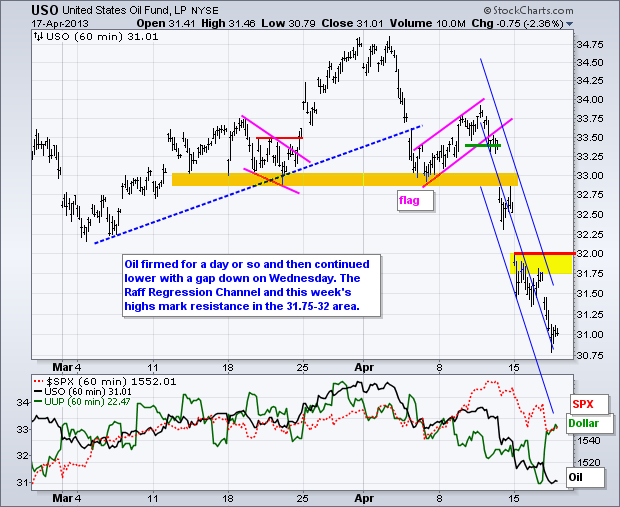
Stocks started the day weak and ended the day with sizable losses. The Russell 2000 ETF (-1.74%) and Nasdaq 100 ETF (-1.95%) led the way lower. Apple weighed on QQQ as the stock broke below its March lows and recorded a 52-week low ahead of earnings next week. All sectors were down with the Energy SPDR (XLE) and Technology SPDR (XLK) falling over 2%. The defensive sectors held up the best. In technology, semis took a big hit with the Semiconductor SPDR (XSD) plunging over 4%. This is a big negative for the technology sector and the market because the semiconductor business is notoriously cyclical. Relative weakness in this key group suggests that the global economy is indeed slowing. Europe is in recession, Chinese growth is slowing, Japan is trying to QE its way out of stagnation and the US is three years into its anemic recovery. Industrial commodities and oil continue to get hammered, which suggest that the economic outlook for the emerging economies is less than stellar. The Copper Miners ETF (COPX), Gold Miners ETF (GDX), Metals & Mining SPDR (XME), Silver Miners ETF (SIL) and Steel ETF (SLX) were hammered yet again. They are in a free fall that smacks of a selling climax, but the falling knife is still pointing down. The Oil & Gas Equipment/Services SPDR (XES), Oil & Gas E&P SPDR (XOP) and Oil Service HOLDRS (OIH) were also hammered and may have further room to fall because oil is in a free fall as well.

**************************************************************************
**************************************************************************
**************************************************************************
**************************************************************************
**************************************************************************
Key Reports and Events (all times Eastern):
Thu - Apr 18 - 08:30 - Jobless Claims
Thu - Apr 18 - 10:00 - Philadelphia Fed Report
Thu - Apr 18 - 10:00 - Leading Indicators
Thu - Apr 18 - 10:30 - Natural Gas Inventories
Charts of Interest: Tuesday and Thursday
This commentary and charts-of-interest are designed to stimulate thinking. This analysis is
not a recommendation to buy, sell, hold or sell short any security (stock ETF or otherwise).
We all need to think for ourselves when it comes to trading our own accounts. First, it is
the only way to really learn. Second, we are the only ones responsible for our decisions.
Think of these charts as food for further analysis. Before making a trade, it is important
to have a plan. Plan the trade and trade the plan. Among other things, this includes setting
a trigger level, a target area and a stop-loss level. It is also important to plan for three
possible price movements: advance, decline or sideways. Have a plan for all three scenarios
BEFORE making the trade. Consider possible holding times. And finally, look at overall market
conditions and sector/industry performance.

About the author:
Arthur Hill, CMT, is the Chief Technical Strategist at TrendInvestorPro.com. Focusing predominantly on US equities and ETFs, his systematic approach of identifying trend, finding signals within the trend, and setting key price levels has made him an esteemed market technician. Arthur has written articles for numerous financial publications including Barrons and Stocks & Commodities Magazine. In addition to his Chartered Market Technician (CMT) designation, he holds an MBA from the Cass Business School at City University in London.
Learn More


