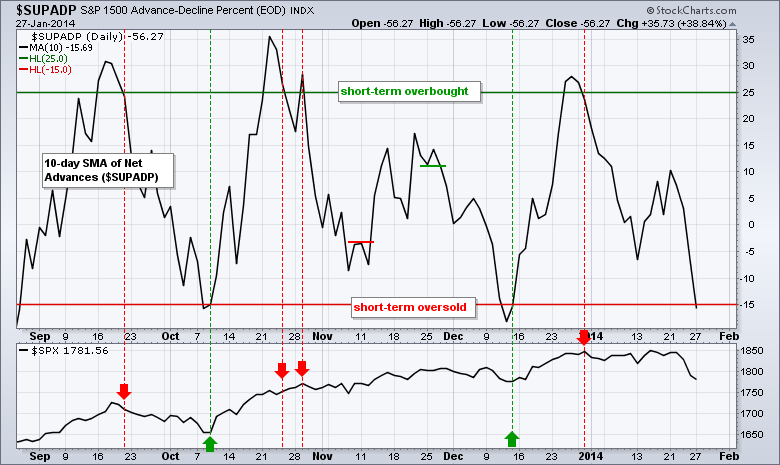
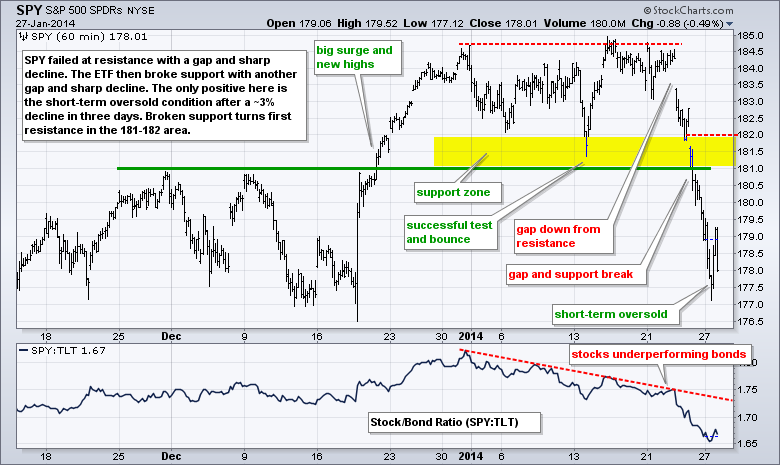
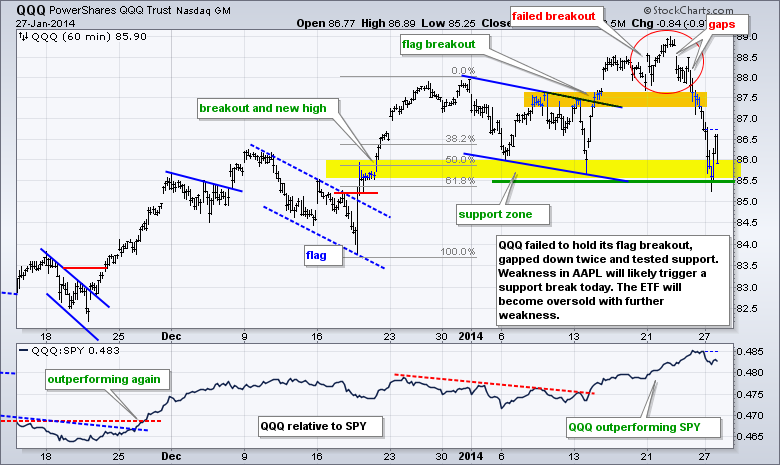
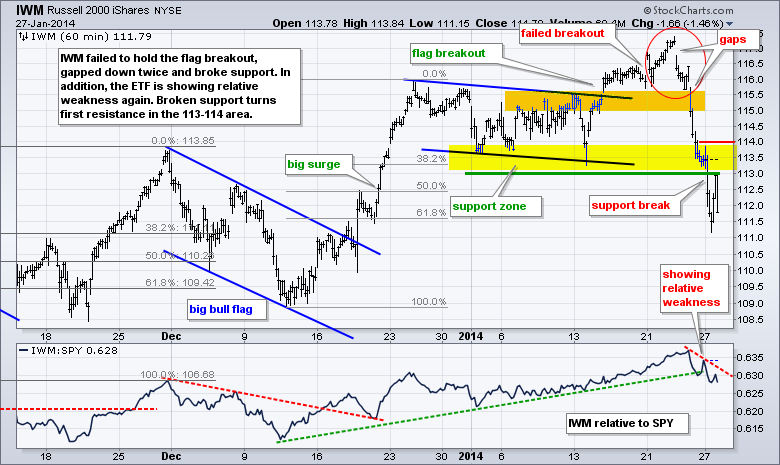
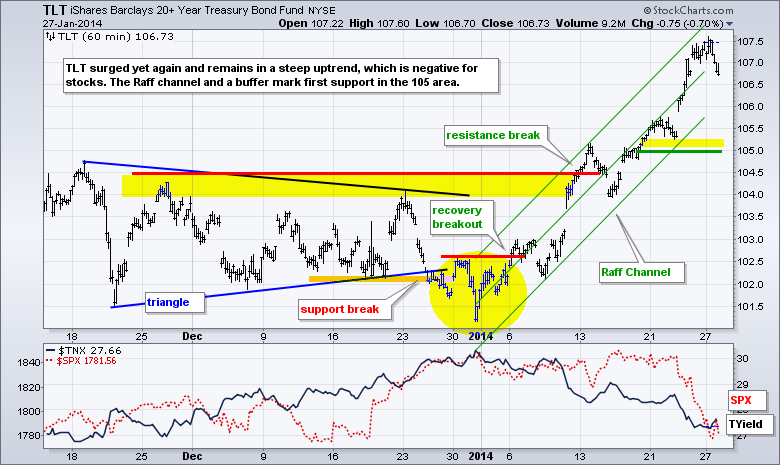
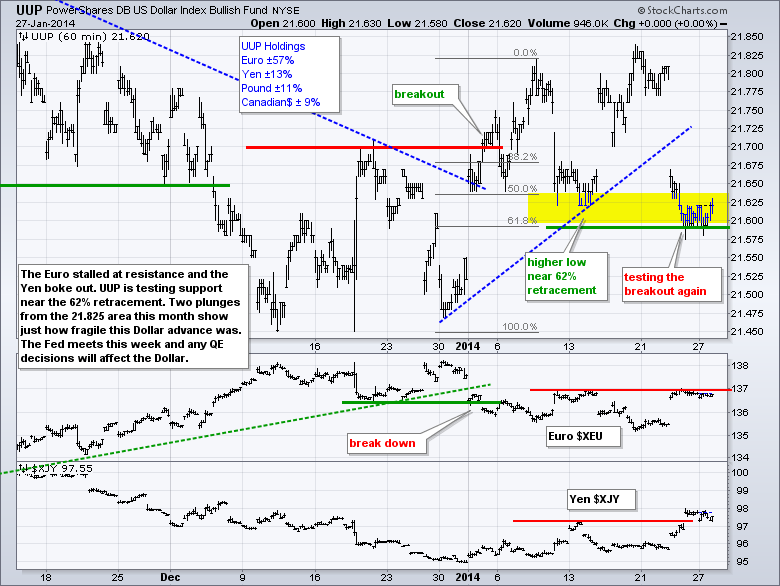
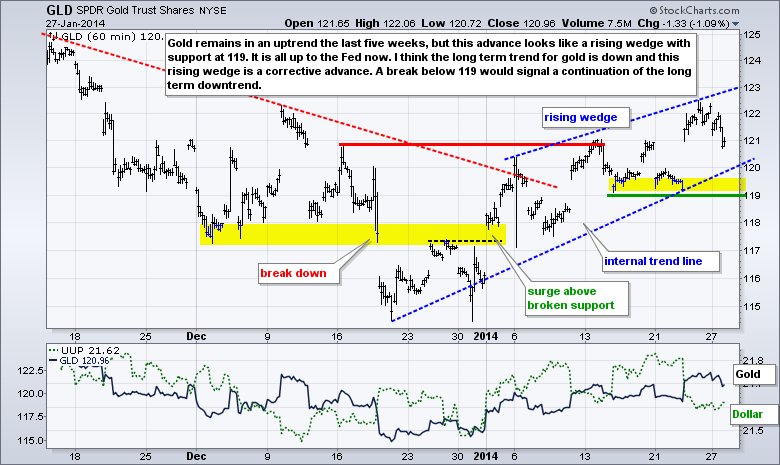
Stocks started the day weak, got a bounce in the afternoon and then moved lower in the final thirty minutes of trading. Overall, the major index ETFs closed with losses and small-caps led the way lower as IWM fell 1.46%. Small-caps were holding up well, but are starting to show relative weakness again and this is a negative for broader market. Seven of the nine sectors were down with utilities and industrials bucking the selling pressure. Industrials were lifted with gains in GE, BA, UTX, HON and CAT. Biotechs got slammed as the Biotech SPDR (XBI) fell over 4%. There were plenty of profits to take in XBI and money clearly moved out of the riskier part of the market on Monday. The chart below shows the 10-day SMA of AD Percent for the S&P 1500 ($SUPADP). AD Percent equals advances less declines divided by total issues. With the bigger trend up, oversold readings in this breadth indicator become quite interesting because they represent possible entry points. Notice how the indicator became oversold in mid October and mid December with dips below -15%. Subsequent moves back above -15% suggested that the uptrend was resuming. Don't forget that Wednesday is Fed day with a policy statement expected at 2PM ET. I do not expect the Fed to blink on QE and the market expects another cut of 10 billion in QE. Further tapering could weigh on gold and boost the Dollar.
**This chart analysis is for educational purposes only, and should not
be construed as a recommendation to buy, sell or sell-short said securities**
**************************************************************
**************************************************************
**************************************************************
**************************************************************
***************************************************************
Key Reports and Events (all times Eastern):
Tue - Jan 28 - 08:30 - Durable Orders
Tue - Jan 28 - 09:00 - Case-Shiller 20-city Index
Tue - Jan 28 - 10:00 - Consumer Confidence
Wed - Jan 29 - 07:00 - MBA Mortgage Index
Wed - Jan 29 - 10:30 - Crude Inventories
Wed - Jan 29 - 14:00 - FOMC Rate Decision
Thu - Jan 30 - 08:30 - Initial Claims
Thu - Jan 30 - 08:30 - GDP
Thu - Jan 30 - 10:00 - Pending Home Sales
Thu - Jan 30 - 10:30 - Natural Gas Inventories
Fri - Jan 31 - 08:30 - Personal Income & Spending
Fri - Jan 31 - 09:45 - Chicago PMI
Fri - Jan 31 - 09:55 - Michigan Sentiment
Charts of Interest: Tuesday and Thursday
This commentary and charts-of-interest are designed to stimulate thinking. This analysis is
not a recommendation to buy, sell, hold or sell short any security (stock ETF or otherwise).
We all need to think for ourselves when it comes to trading our own accounts. First, it is
the only way to really learn. Second, we are the only ones responsible for our decisions.
Think of these charts as food for further analysis. Before making a trade, it is important
to have a plan. Plan the trade and trade the plan. Among other things, this includes setting
a trigger level, a target area and a stop-loss level. It is also important to plan for three
possible price movements: advance, decline or sideways. Have a plan for all three scenarios
BEFORE making the trade. Consider possible holding times. And finally, look at overall market
conditions and sector/industry performance.

