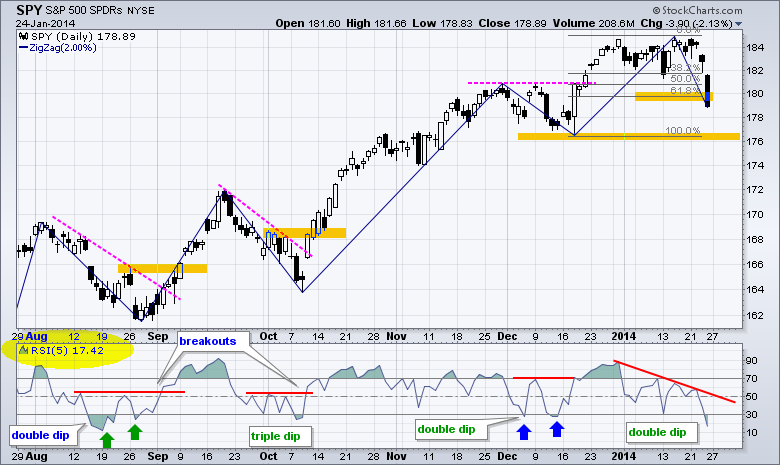
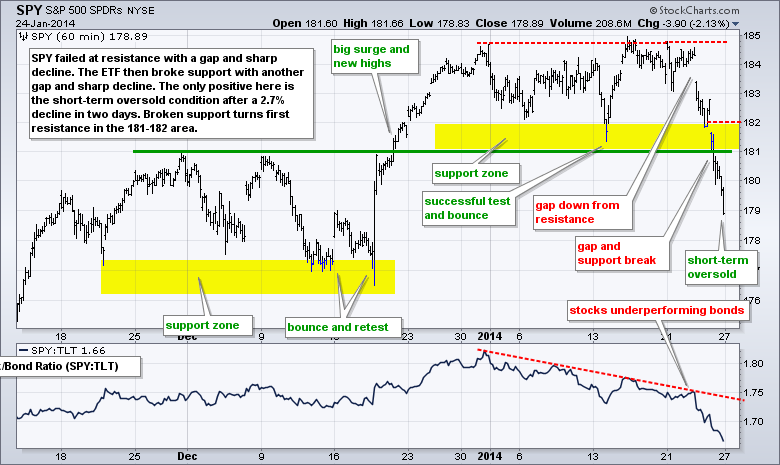
Stocks were finally hit with strong selling pressure over the last two days. Despite a sharp two-day decline, the bigger trends remain up and the mean reversion players are thinking bounce. SPY fell over 2% for the fourth time since August. The chart below shows daily candlesticks with the two percent Zigzag indicator, which filters out moves less than 2%. Most recently, SPY fell two percent in early December and then surged in the second half of the month. The indicator window shows 5-period RSI moving below 30 for the sixth time since August. We also have a double dip working as RSI touched 30 in mid January and dipped below 30 on Friday. Short-term, this argues for a sideways day or even a bounce. A move above 50 would turn RSI bullish again. At this point, I am concerned that we could see a situation similar to mid August. Notice how SPY bounced for two days and then continued lower before delivering a decent upswing in early September. This means we may see a small bounce to the 181-182 area and then another dip to the 176-177 area. It is a big week for earnings and we also have a Fed policy statement on Wednesday. Apple reports today after the close as well so we can probably expect some fireworks the next few days.
**This chart analysis is for educational purposes only, and should not
be construed as a recommendation to buy, sell or sell-short said securities**
**************************************************************
**************************************************************
**************************************************************
**************************************************************
***************************************************************
Key Reports and Events (all times Eastern):
Mon - Jan 27 - 10:00 - New Home Sale
Tue - Jan 28 - 08:30 - Durable Orders
Tue - Jan 28 - 09:00 - Case-Shiller 20-city Index
Tue - Jan 28 - 10:00 - Consumer Confidence
Wed - Jan 29 - 07:00 - MBA Mortgage Index
Wed - Jan 29 - 10:30 - Crude Inventories
Wed - Jan 29 - 14:00 - FOMC Rate Decision
Thu - Jan 30 - 08:30 - Initial Claims
Thu - Jan 30 - 08:30 - GDP
Thu - Jan 30 - 10:00 - Pending Home Sales
Thu - Jan 30 - 10:30 - Natural Gas Inventories
Fri - Jan 31 - 08:30 - Personal Income & Spending
Fri - Jan 31 - 09:45 - Chicago PMI
Fri - Jan 31 - 09:55 - Michigan Sentiment
Charts of Interest: Tuesday and Thursday
This commentary and charts-of-interest are designed to stimulate thinking. This analysis is
not a recommendation to buy, sell, hold or sell short any security (stock ETF or otherwise).
We all need to think for ourselves when it comes to trading our own accounts. First, it is
the only way to really learn. Second, we are the only ones responsible for our decisions.
Think of these charts as food for further analysis. Before making a trade, it is important
to have a plan. Plan the trade and trade the plan. Among other things, this includes setting
a trigger level, a target area and a stop-loss level. It is also important to plan for three
possible price movements: advance, decline or sideways. Have a plan for all three scenarios
BEFORE making the trade. Consider possible holding times. And finally, look at overall market
conditions and sector/industry performance.

