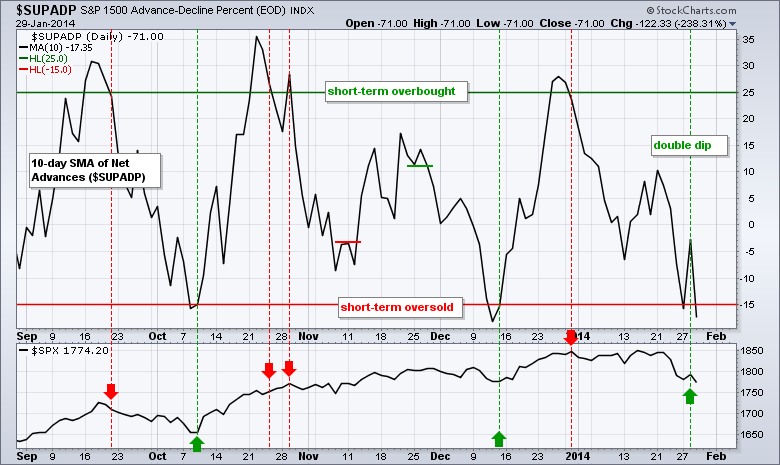
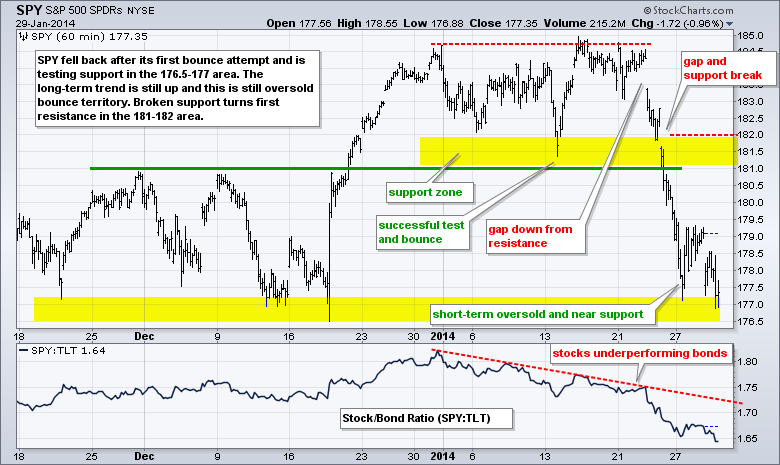
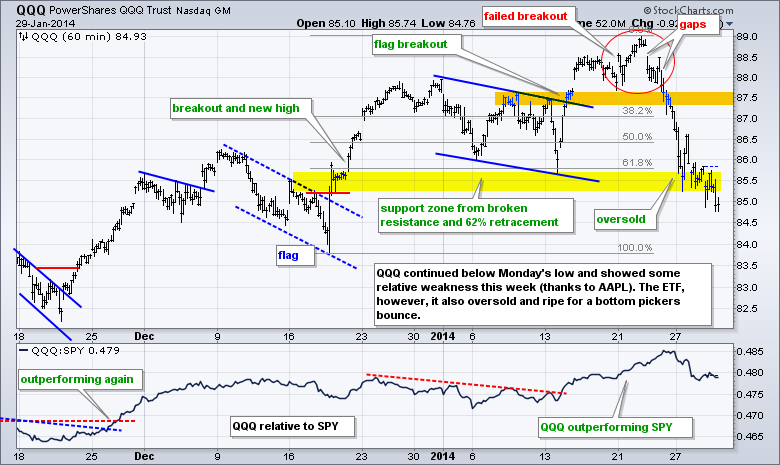
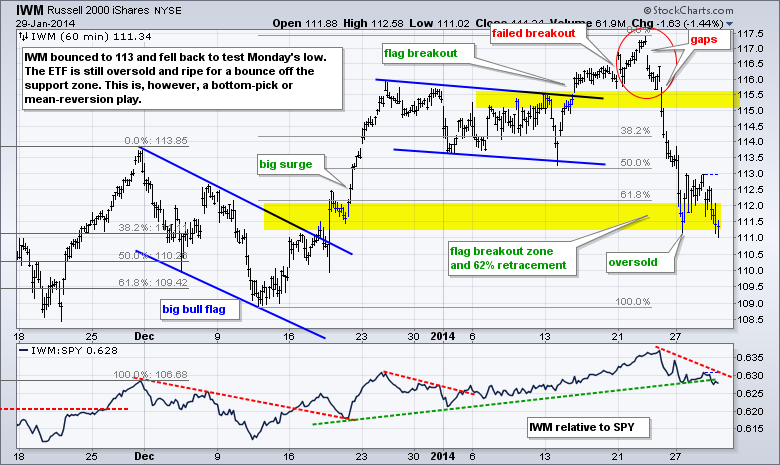
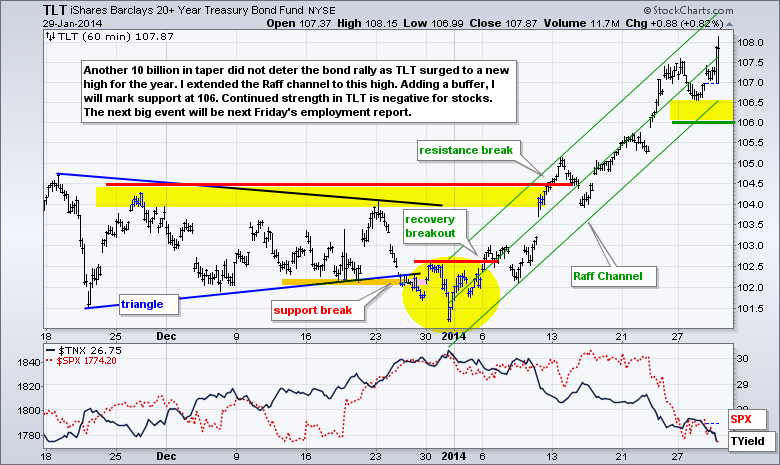
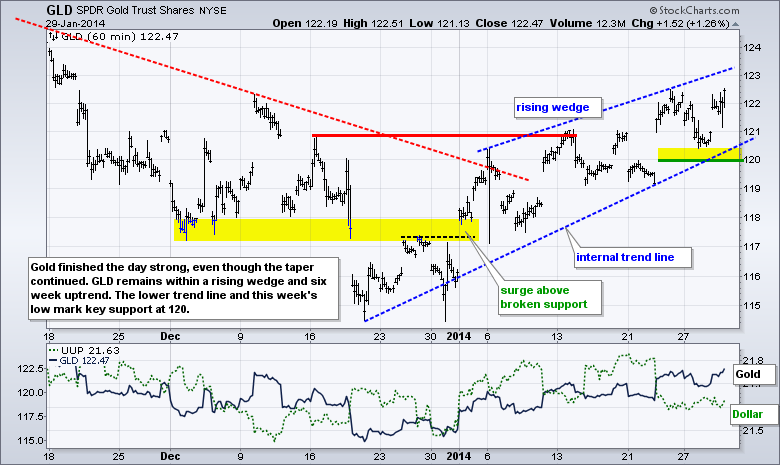
After a small bounce late Monday and Tuesday, stocks opened weak and remained weak on Wednesday. Stocks are still short-term oversold and the long-term trend remains up. This means we have a setup for an oversold bounce. The chart below shows the 10-day SMA for S&P 1500 AD Percent ($SUPADP). AD Percent equals advances less declines divided by total issues. Prior dips below -15% provided short-term buying opportunities, but we are now seeing a double dip with a second move below 15% in three days. Despite oversold conditions, there are some negative forces that may limit an oversold bounce. First, small-caps are starting to show relative weakness. Second, Treasury bonds remain strong and money is moving into relative safety. Even though the Fed continued its taper, gold and Treasuries closed higher on Wednesday. On the positive side, semiconductors and homebuilders held up relatively well on Wednesday. The Fed is past and the Employment report looms next week. For now, we are still in the middle of earnings season with BRCM, GOOG, MMM, RYL, WHR and XOM reporting today.
**This chart analysis is for educational purposes only, and should not
be construed as a recommendation to buy, sell or sell-short said securities**
**************************************************************
**************************************************************
**************************************************************
**************************************************************
***************************************************************
Key Reports and Events (all times Eastern):
Thu - Jan 30 - 08:30 - Initial Claims
Thu - Jan 30 - 08:30 - GDP
Thu - Jan 30 - 10:00 - Pending Home Sales
Thu - Jan 30 - 10:30 - Natural Gas Inventories
Fri - Jan 31 - 08:30 - Personal Income & Spending
Fri - Jan 31 - 09:45 - Chicago PMI
Fri - Jan 31 - 09:55 - Michigan Sentiment
Charts of Interest: Tuesday and Thursday
This commentary and charts-of-interest are designed to stimulate thinking. This analysis is
not a recommendation to buy, sell, hold or sell short any security (stock ETF or otherwise).
We all need to think for ourselves when it comes to trading our own accounts. First, it is
the only way to really learn. Second, we are the only ones responsible for our decisions.
Think of these charts as food for further analysis. Before making a trade, it is important
to have a plan. Plan the trade and trade the plan. Among other things, this includes setting
a trigger level, a target area and a stop-loss level. It is also important to plan for three
possible price movements: advance, decline or sideways. Have a plan for all three scenarios
BEFORE making the trade. Consider possible holding times. And finally, look at overall market
conditions and sector/industry performance.

