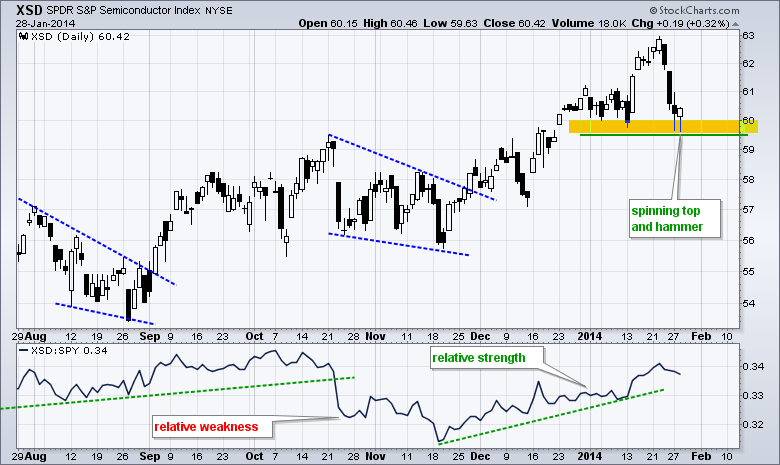
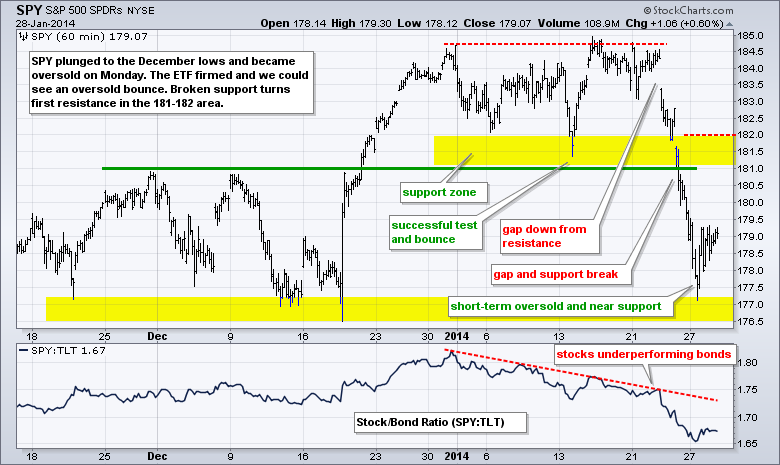
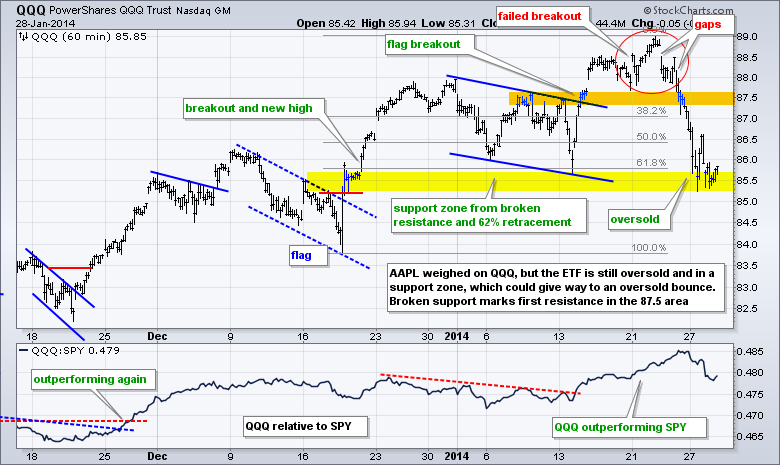
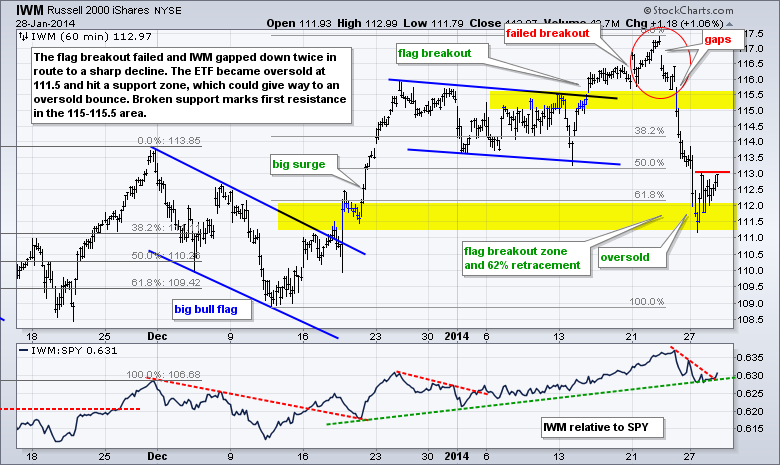
Stocks firmed on Tuesday and managed a bounce with the Russell 2000 ETF (IWM) leading the way. Eight of the nine sectors were up with the Finance SPDR (XLF) and HealthCare SPDR (XLV) advancing over 1.3%. The Technology SPDR (XLK) fell as weakness in Apple hit this market-cap weighted SPDR hard. Within the consumer discretionary sector, the Home Construction iShares (ITB) surged over 3% to challenge flag resistance. Within the technology sector, the Internet ETF (FDN) surged around 2% in anticipation of a blowout report from Google on Thursday. The chart below shows the Semiconductor SPDR (XSD) hitting support with a spinning top on Monday. The ETF formed a small hammer on Tuesday and could be poised for an oversold bounce. Today is Fed day so we can expect some extra volatility around 2PM when the Fed releases its policy statement.
**This chart analysis is for educational purposes only, and should not
be construed as a recommendation to buy, sell or sell-short said securities**
**************************************************************
**************************************************************
**************************************************************
**************************************************************
***************************************************************
Key Reports and Events (all times Eastern):
Wed - Jan 29 - 07:00 - MBA Mortgage Index
Wed - Jan 29 - 10:30 - Crude Inventories
Wed - Jan 29 - 14:00 - FOMC Rate Decision
Thu - Jan 30 - 08:30 - Initial Claims
Thu - Jan 30 - 08:30 - GDP
Thu - Jan 30 - 10:00 - Pending Home Sales
Thu - Jan 30 - 10:30 - Natural Gas Inventories
Fri - Jan 31 - 08:30 - Personal Income & Spending
Fri - Jan 31 - 09:45 - Chicago PMI
Fri - Jan 31 - 09:55 - Michigan Sentiment
Charts of Interest: Tuesday and Thursday
This commentary and charts-of-interest are designed to stimulate thinking. This analysis is
not a recommendation to buy, sell, hold or sell short any security (stock ETF or otherwise).
We all need to think for ourselves when it comes to trading our own accounts. First, it is
the only way to really learn. Second, we are the only ones responsible for our decisions.
Think of these charts as food for further analysis. Before making a trade, it is important
to have a plan. Plan the trade and trade the plan. Among other things, this includes setting
a trigger level, a target area and a stop-loss level. It is also important to plan for three
possible price movements: advance, decline or sideways. Have a plan for all three scenarios
BEFORE making the trade. Consider possible holding times. And finally, look at overall market
conditions and sector/industry performance.

