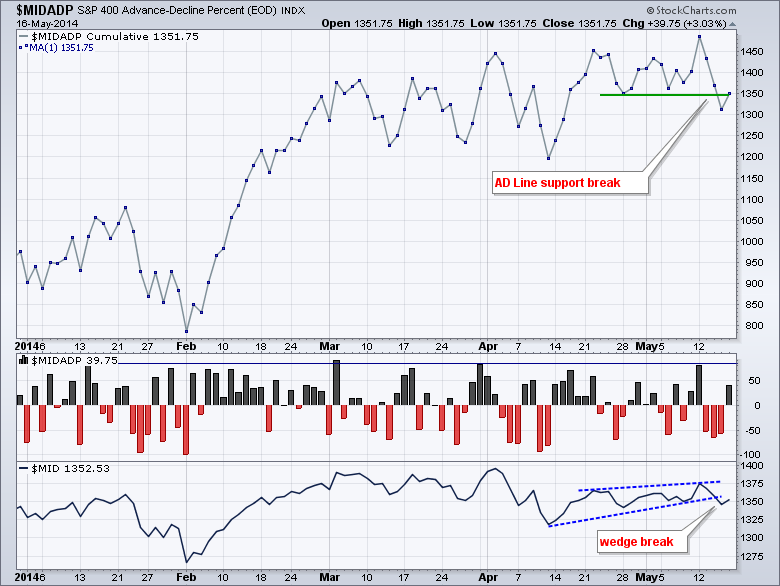
Stocks remain mixed overall, but selling pressure is quietly spreading. The S&P 500 SPDR and Nasdaq 100 ETF continue to hold up well, but the Russell 2000 ETF and small-caps remain relatively weak. The market as a whole remains vulnerable as long as small-caps under perform. Note that mid-caps are also starting to weaken and selling pressure could be spreading. The chart below shows the AD Line for the S&P MidCap 400 ($MIDADP). This breadth indicator broke below its late April low and the S&P MidCap 400 broke the wedge trend line.
**This chart analysis is for educational purposes only, and should not
be construed as a recommendation to buy, sell or sell-short said securities**
*************************************************************
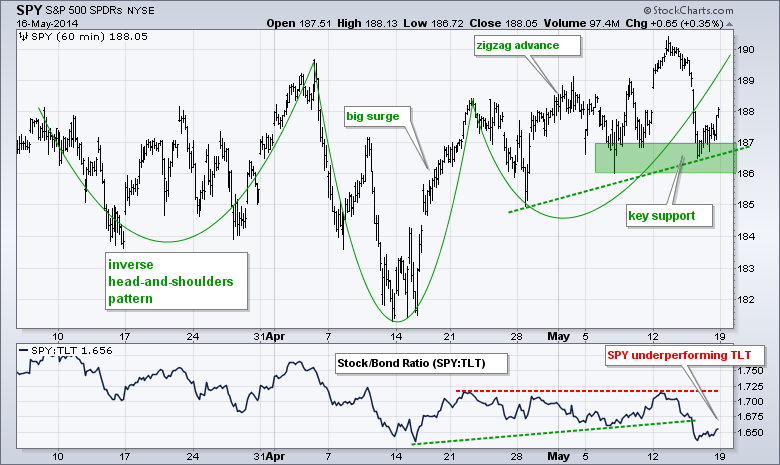
SPY bounced off the support zone to keep the zigzag advance alive. This move reinforces support in the 186-187 area. Even though the overall uptrend is still in place, SPY is underperforming TLT and small-caps continued to weigh on the market overall. A break below support at 186 would reverse the short-term upswing and signal that large-caps are coming under selling pressure.
**************************************************************
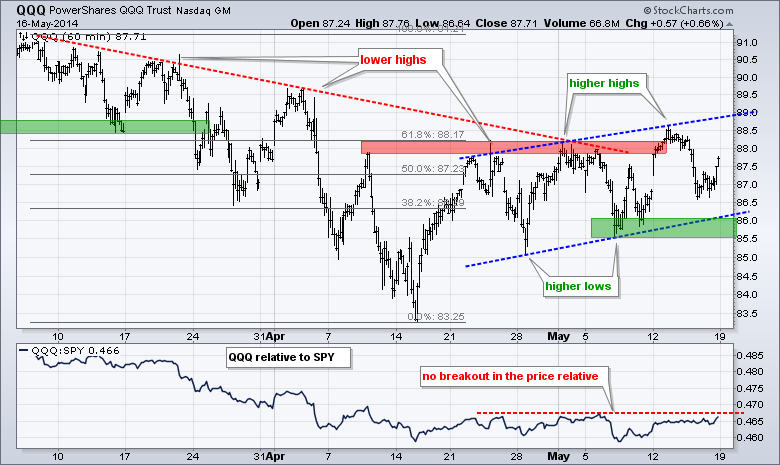
QQQ remains in a short-term uptrend with a series of higher highs and higher lows the last few weeks. The ETF even managed to hold above the early May low last week and bounce. I will leave key support in the 85.5-86 area. Overall, a rising wedge could be forming from the mid April lows to the mid May high. A support break would signal a continuation of the prior decline (early March to mid April).
**************************************************************
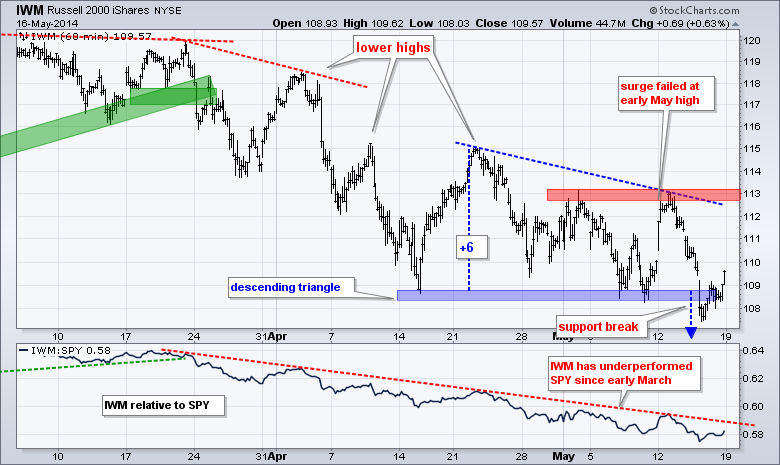
IWM remains the weakest of the major index ETFs. The ETF broke descending triangle support and immediately rebounded with a surge above 109 on Friday. I am not, however, ready to call this a failed break or bear trap. The overall trend is clearly down and the ETF shows serious relative weakness. Key resistance remains at 113.
**************************************************************
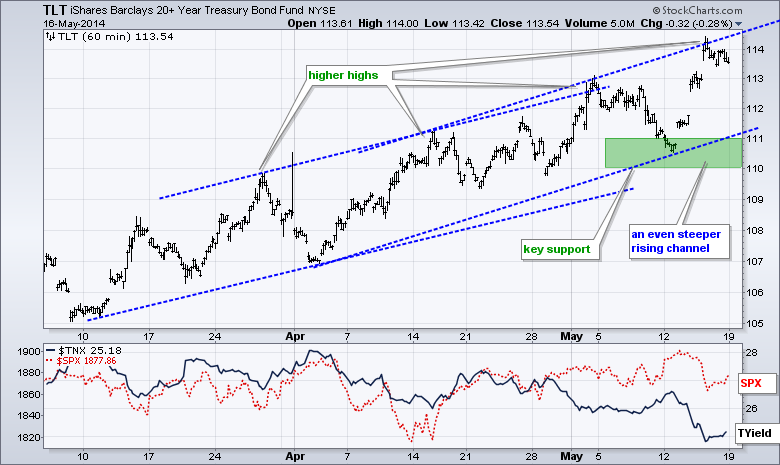
No change. The 20+ YR T-Bond ETF (TLT) surged to yet another new high and we can now draw an even steeper rising channel. TLT is once again short-term overbought as it hits the upper trend line, but is by no means weak. The lower trend line and recent lows combine to mark key support in the 110-111 area.
**************************************************************
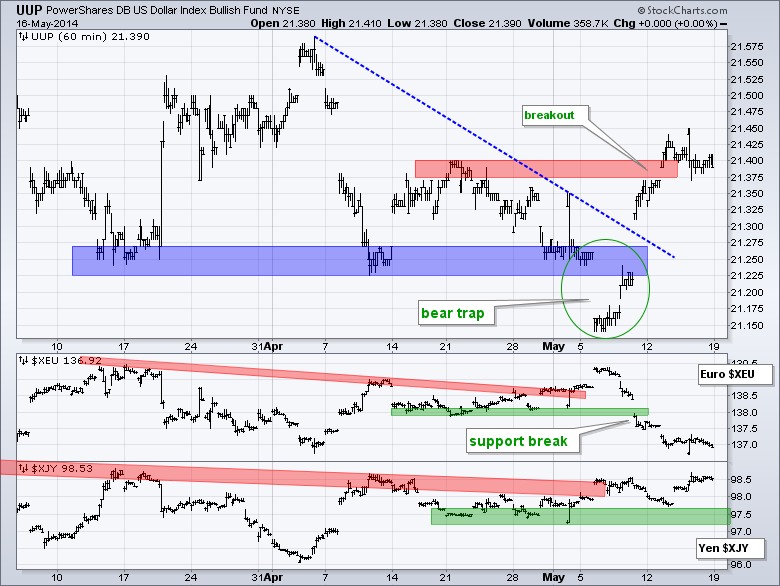
No change. The US Dollar ETF (UUP) continued higher and broke above the late April highs. The bear trap provided the first sign of a trend reversal and this follow through breakout signals the start of an uptrend. Dollar strength is built on Euro weakness as the Euro Index ($XEU) broke support with a sharp decline over the last few days.
**************************************************************
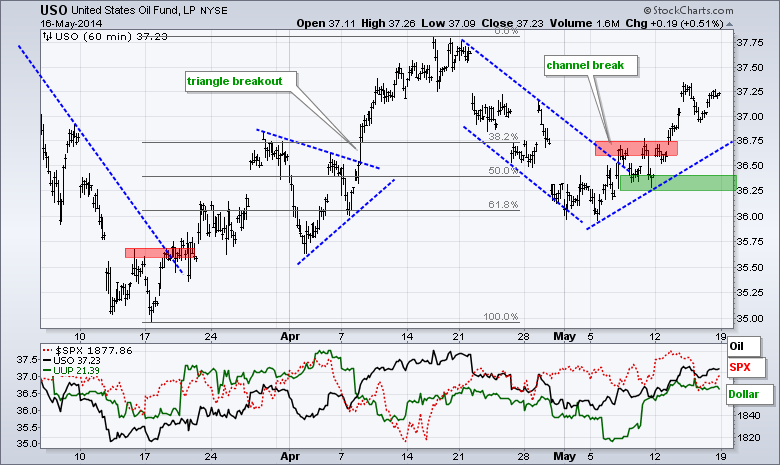
No change. The USO Oil Fund (USO) broke out with a surge above 36.75 on Tuesday. Overall, the ETF retraced 62% of the prior decline with a falling channel and found support in the 36 area in early May. The trend line break was the first positive and today's break argues for a continuation of the March-April advance. Key support is set at 36.25.
**************************************************************
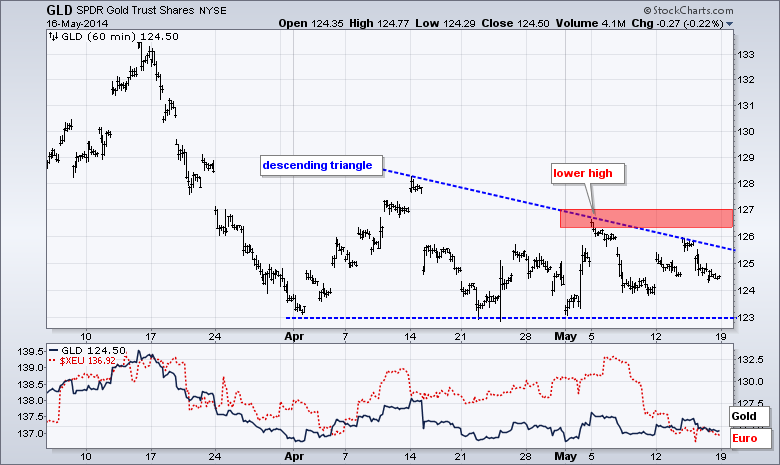
No change. Gold could not breakout with tensions in Ukraine and must now contend with a strengthening Dollar. The Gold SPDR (GLD) remains with a descending triangle, which is a bearish continuation pattern. The lower high in early May indicates that buying pressure was not strong enough to trigger a breakout or upside follow through to the bounce. The relatively equal lows represent the demand line. A break here would signal a victory for supply and target a move to the 118 area.
***************************************************************
Key Reports and Events (all times Eastern):
Wed - May 21 - 07:00 - MBA Mortgage Index
Wed - May 21 - 10:30 - Crude Inventories
Wed - May 21 - 14:00 - FOMC Minutes
Thu - May 22 - 08:30 - Initial Claims
Thu - May 22 - 10:00 - Existing Home Sales
Thu - May 22 - 10:00 - Leading Indicators
Thu - May 22 - 10:30 - Natural Gas Inventories
Fri - May 23 - 10:00 - New Home Sales
This commentary and charts-of-interest are designed to stimulate thinking. This analysis is not a recommendation to buy, sell, hold or sell short any security (stock ETF or otherwise). We all need to think for ourselves when it comes to trading our own accounts. First, it is the only way to really learn. Second, we are the only ones responsible for our decisions. Think of these charts as food for further analysis. Before making a trade, it is important to have a plan. Plan the trade and trade the plan. Among other things, this includes setting a trigger level, a target area and a stop-loss level. It is also important to plan for three possible price movements: advance, decline or sideways. Have a plan for all three scenarios BEFORE making the trade. Consider possible holding times. And finally, look at overall market conditions and sector/industry performance.


