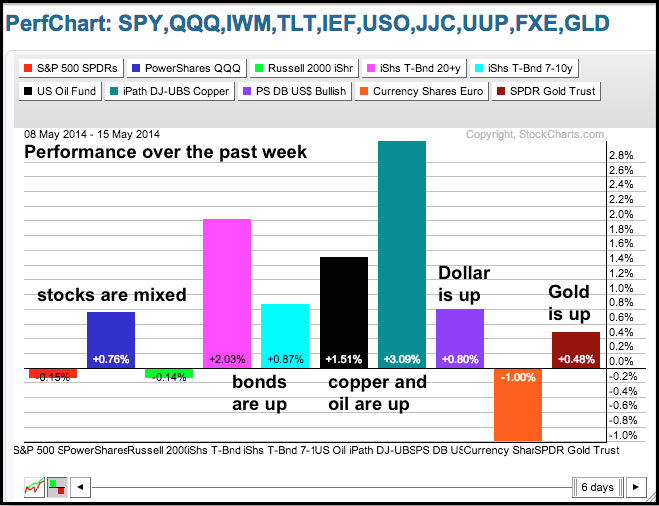
Stocks took it on the chin Thursday with the major index ETFs falling across the board. Reading the financial media, one would have expected 2+ percent declines and blood in the street. The losses, however, where relatively modest and the Russell 2000 did not lead the way lower. The Dow Diamonds fell .94% to lead lower and IWM lost just .70% on the day. All sectors were down with materials, energy and finance leading the way. Stock market weakness can once again be attributed to strength in the bond market. The 20+ YR T-Bond ETF surged .80% and closed at a new high for the year. This pushed the 10-YR Treasury Yield ($TNX) to its lowest level since late October. It is pretty amazing to see the 10-YR Treasury Yield fall along with jobless claims, which dipped below 300,000 for the first time since May 2007. It is what it is. The 6-day PerfChart below paints a strange picture indeed. Stocks are mixed, bonds are up, commodities are up and the Dollar is up.
**This chart analysis is for educational purposes only, and should not
be construed as a recommendation to buy, sell or sell-short said securities**
*************************************************************
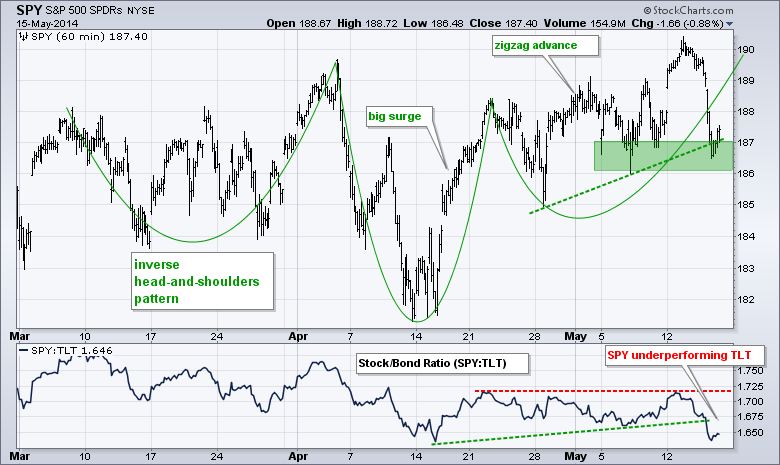
SPY edged above its early April high and then fell back with a sharp decline. (190 to 187). The overall trend remains up as a zigzag advance takes shape. SPY, however, is right at support from the early May lows and a key test looms. A break below 186 would reverse the four week zigzag and start a short-term downtrend. The indicator window shows the SPY:TLT ratio failing to take out its late April highs and breaking down yet again. Stocks continue to underperform bonds.
**************************************************************
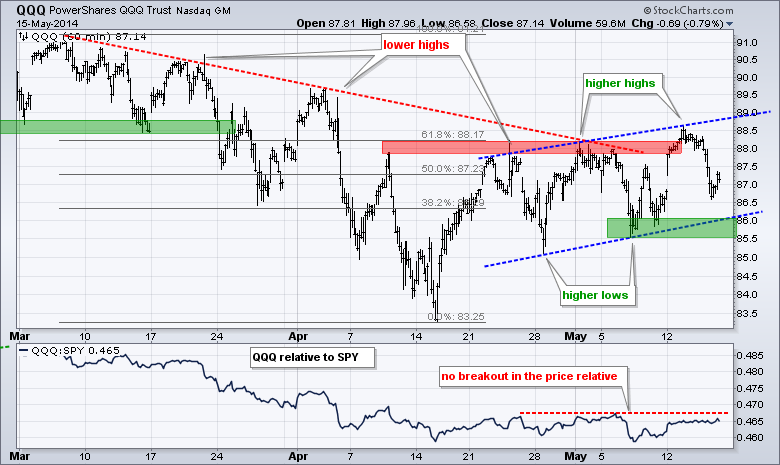
QQQ edged above its early May high on Tuesday and then fell back the last two days. There is still an upward bias with a zigzag advance over the last four weeks. The lower trend line and early May lows mark key support in the 85.5-86 area. A break below 85.5 would reverse the short-term upswing and signal a continuation of the prior decline (early March to mid April).
**************************************************************
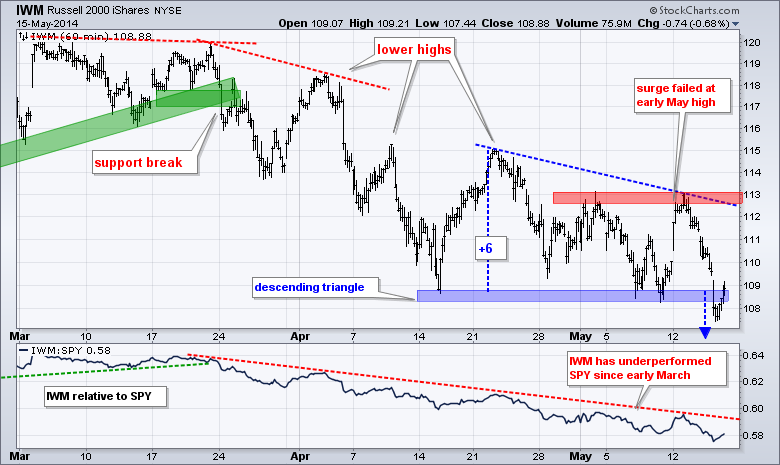
No change. IWM failed at the early May high and fell around 3% in less than two days (113 to 109.62). There are two patterns at work. First, the relatively equal lows and the low high in May combine for a descending triangle, which is a bearish continuation pattern. Second, a bounce back above the 111 level would forge a reaction low and raise the prospect of a small inverse head-and-shoulders. Either way, a break above 113 is needed for a reversal. For now, I think the overall downtrend makes the descending triangle the dominant pattern.
**************************************************************
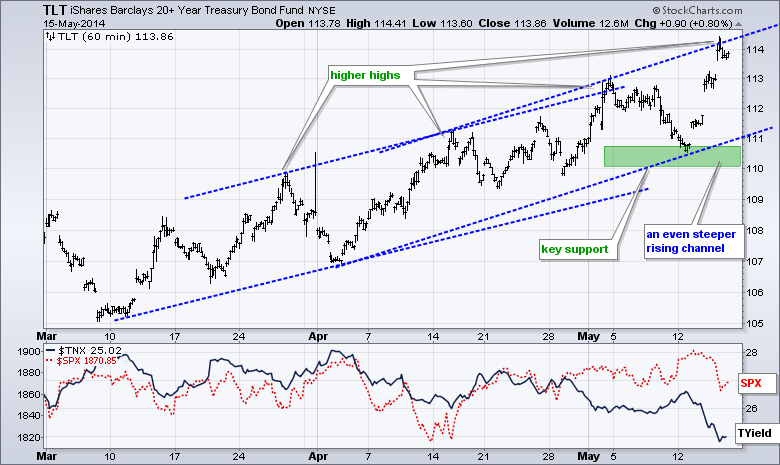
The 20+ YR T-Bond ETF (TLT) surged to yet another new high and we can now draw an even steeper rising channel. TLT is once again short-term overbought as it hits the upper trend line, but is by no means weak. The lower trend line and recent lows combine to mark key support in the 110-111 area.
**************************************************************
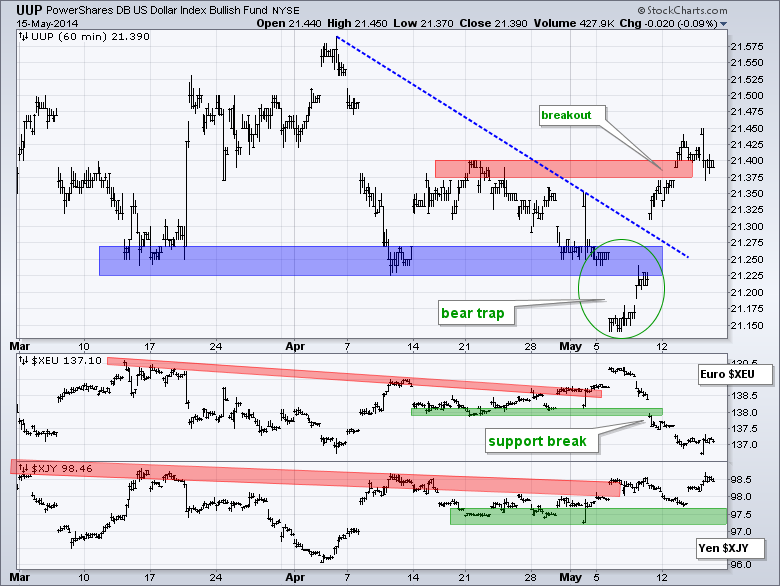
No change. The US Dollar ETF (UUP) continued higher and broke above the late April highs. The bear trap provided the first sign of a trend reversal and this follow through breakout signals the start of an uptrend. Dollar strength is built on Euro weakness as the Euro Index ($XEU) broke support with a sharp decline over the last few days.

**************************************************************
No change. The USO Oil Fund (USO) broke out with a surge above 36.75 on Tuesday. Overall, the ETF retraced 62% of the prior decline with a falling channel and found support in the 36 area in early May. The trend line break was the first positive and today's break argues for a continuation of the March-April advance. Key support is set at 36.25.
**************************************************************
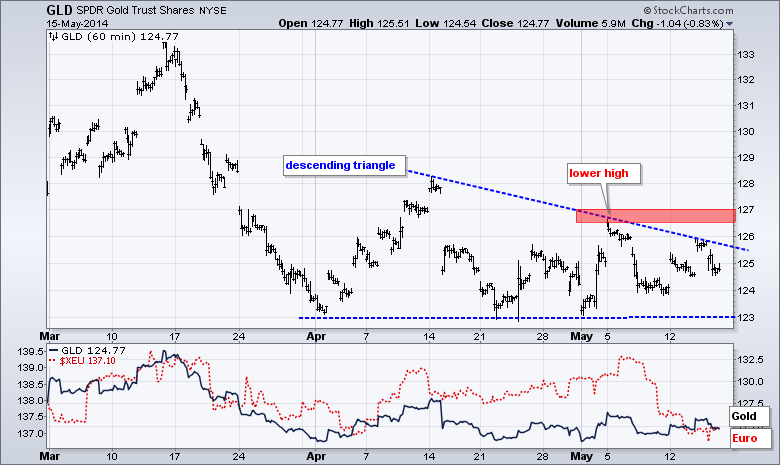
No change. Gold could not breakout with tensions in Ukraine and must now contend with a strengthening Dollar. The Gold SPDR (GLD) remains with a descending triangle, which is a bearish continuation pattern. The lower high in early May indicates that buying pressure was not strong enough to trigger a breakout or upside follow through to the bounce. The relatively equal lows represent the demand line. A break here would signal a victory for supply and target a move to the 118 area.
***************************************************************
Key Reports and Events (all times Eastern):
Fri - May 16 - 08:30 - Housing Starts/Building Permits
Fri - May 16 - 09:55 - Michigan Sentiment
This commentary and charts-of-interest are designed to stimulate thinking. This analysis is not a recommendation to buy, sell, hold or sell short any security (stock ETF or otherwise). We all need to think for ourselves when it comes to trading our own accounts. First, it is the only way to really learn. Second, we are the only ones responsible for our decisions. Think of these charts as food for further analysis. Before making a trade, it is important to have a plan. Plan the trade and trade the plan. Among other things, this includes setting a trigger level, a target area and a stop-loss level. It is also important to plan for three possible price movements: advance, decline or sideways. Have a plan for all three scenarios BEFORE making the trade. Consider possible holding times. And finally, look at overall market conditions and sector/industry performance.


