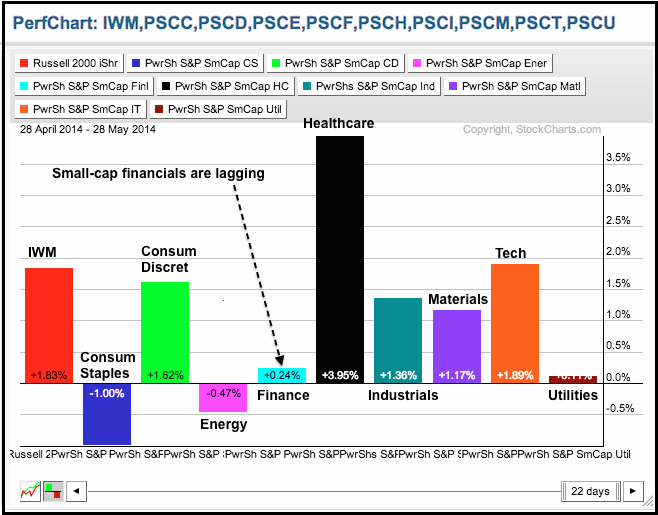
Note that I will be taking a day off on Friday and Art's charts will not be updated until Monday. Stocks took a breather on Wednesday with small losses in the major index ETFs. The Russell 2000 ETF and Russell MicroCap iShares suffered the biggest losses, but the declines were around half a percent. The sectors were mixed with four up and five down. The gains and losses, however, were very small. Utilities were the standout performer as the Utilities SPDR gained .62% on the day. Banks were week as the Regional Bank SPDR dropped .70%. Further declines in the 10-YR Treasury Yield did not help as this key rate dipped to its lowest level since the summer of 2013. Even though lower yields translate into lower borrowing costs, lower yields are not helping the banks because the yield spread is narrowing. The PerfChart below shows the Russell 2000 ETF and the nine small-cap sector ETFs. Notice that the S&P Small-Cap Financials ETF (PSCF) is lagging over the past month. This is the biggest sector in the Russell 2000 and relative weakness in financials casts a shadow on the recent breakout.
**This chart analysis is for educational purposes only, and should not
be construed as a recommendation to buy, sell or sell-short said securities**
*************************************************************
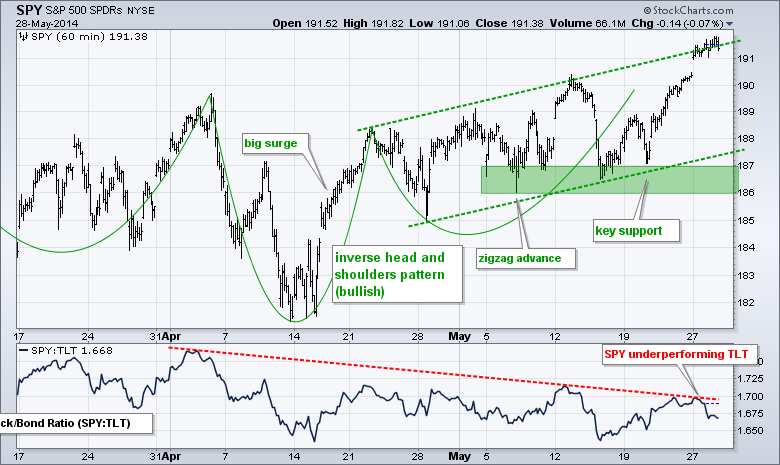
No change. SPY remains in a clear and present uptrend. After surging from 182 to 188 in mid April, the ETF embarked on a zigzag advance with a series of higher highs and higher lows. The most recent higher high occurred on Friday. The May lows combine to mark a support zone in the 186-187 area. SPY is still underperforming TLT, but the price relative (SPY:TLT ratio) is near the trend line extending down from early April. A break above this trend line and the mid May high would signal relative strength in stocks (versus Treasuries).
**************************************************************
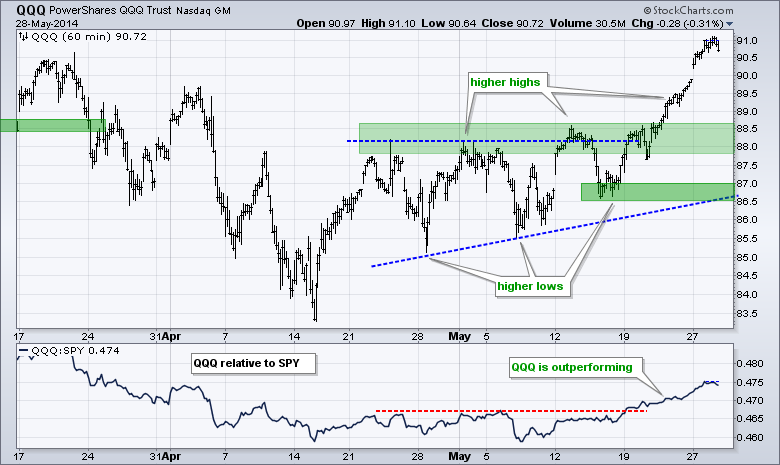
Apple powered QQQ above its early April high as the uptrend accelerated. The pattern from late April to mid May resembles an ascending triangle, which is a bullish continuation pattern. The higher lows indicate that buying pressure is coming in at successively higher price points. The breakouts above 88 confirm the pattern to signal a continuation of the mid April surge. Broken resistance turns first support in the 88-88.5 area. The indicator window shows the QQQ:SPY ratio breaking out last week and moving higher again this week.
**************************************************************
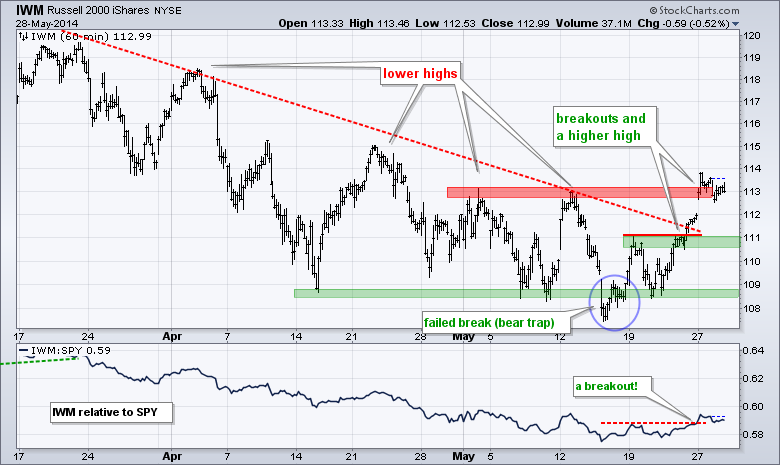
IWM completed its trend reversal with a break above the mid May high. Overall, the ETF forged a bear trap in mid May, held 108.5 support on a subsequent test, broke above the trend line last week and forged a higher high this week. Broken resistance turns first support in the 110.5-111 area. The indicator window shows the price relative breaking above last week's high as IWM starts to outperform again.
**************************************************************
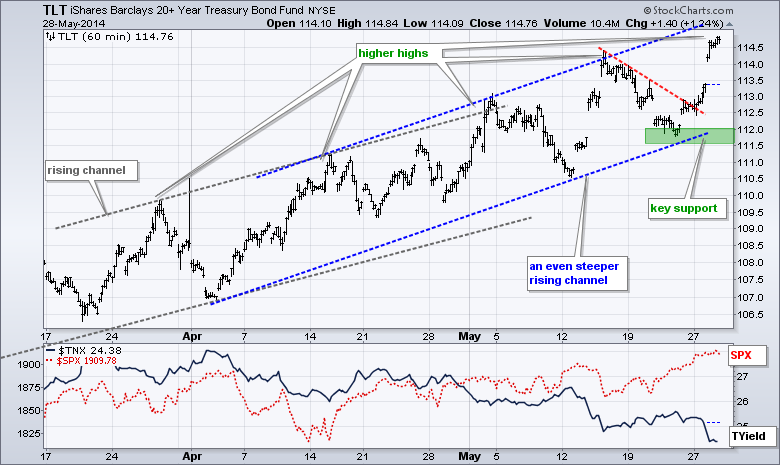
No change. The 20+ YR T-Bond ETF (TLT) held support near the channel trend line and broke above the red trend line extending down from the mid May high. This reverses the short downswing and forges a reaction low in the 111.5-112 area. I will now use this higher low and channel trend line to mark key support.
**************************************************************
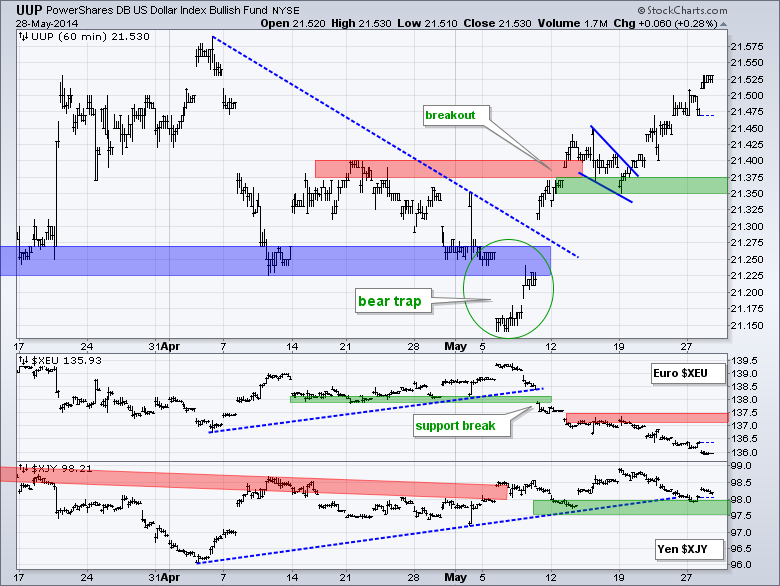
No change. The US Dollar ETF (UUP) is looking more and more bullish. First, UUP failed to hold the support break and formed a bear trap in early May. Second, the ETF broke out with a surge above 21.40. Third, the ETF consolidated and then continued higher with a surge above 21.45 last week. Last week's lows now mark first support in the 21.35 area. The Euro Index ($XEU) sank below its early April low and shows weakness. Key resistance is set at 137.50
**************************************************************
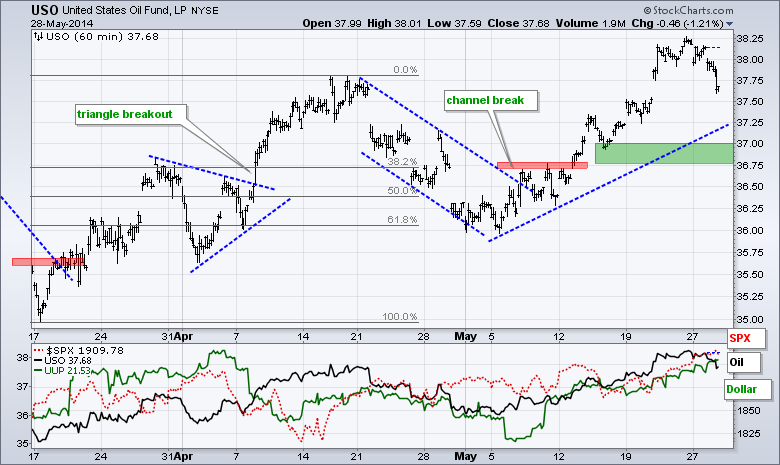
No change. The USO Oil Fund (USO) continued its advance with a move to 37.50 on Monday. Note that USO broke channel resistance in early May and this signaled a continuation of the prior advance (mid March to mid April). The May trend line, broken resistance and a buffer combine to mark key support in the 36.5-36.75 area.
**************************************************************
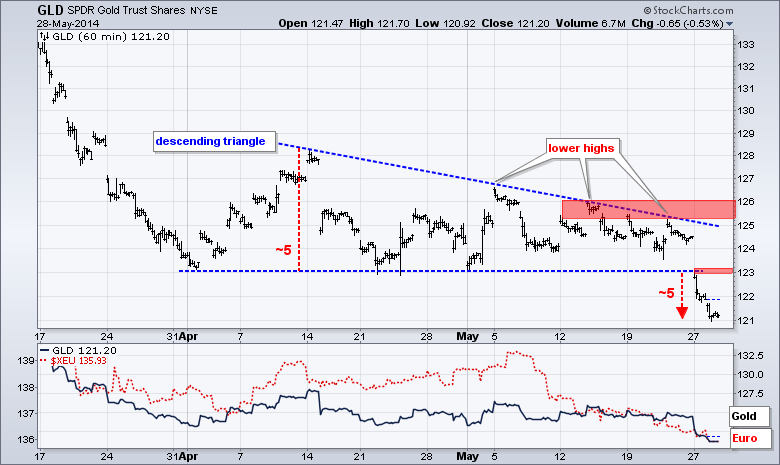
No change. Gold is in a long-term downtrend, medium-term downtrend and short-term downtrend. The Gold SPDR (GLD) formed a descending triangle over the last eight weeks and broke support with a sharp decline on Tuesday. This signals a continuation of the downtrend and targets a move to the 118 area. The mid May highs mark key resistance in the 125-126 area. Broken support in the 123 area turns first resistance to watch for signs of a bear trap.
***************************************************************
Key Reports and Events (all times Eastern):
Thu - May 29 - 08:30 - Initial Jobless Claims
Thu - May 29 - 08:30 - GDP
Thu - May 29 - 10:00 - Pending Home Sales
Thu - May 29 - 10:30 - Natural Gas Inventories
Thu - May 29 - 11:00 - Crude Oil Inventories
Fri - May 30 - 08:30 - Personal Income & Spending
Fri - May 30 - 09:45 - Chicago PMI
Fri - May 30 - 09:55 - Michigan Sentiment
This commentary and charts-of-interest are designed to stimulate thinking. This analysis is not a recommendation to buy, sell, hold or sell short any security (stock ETF or otherwise). We all need to think for ourselves when it comes to trading our own accounts. First, it is the only way to really learn. Second, we are the only ones responsible for our decisions. Think of these charts as food for further analysis. Before making a trade, it is important to have a plan. Plan the trade and trade the plan. Among other things, this includes setting a trigger level, a target area and a stop-loss level. It is also important to plan for three possible price movements: advance, decline or sideways. Have a plan for all three scenarios BEFORE making the trade. Consider possible holding times. And finally, look at overall market conditions and sector/industry performance.


