Today's charts feature five setups from across the board. A key industrial metal retraced 50-62% of its prior advance and may hit resistance soon. A game retailer with high short interest gapped up. An oil services company shows signs of firming in a key retracement zone. Oil hit resistance from its prior highs. And, a key industry-group ETF continues to underperform the broader market.
Video is not available at the moment because we moved to a new blogging platform recently. We are working on the technical issues required to incorporate videos again. Thanks for your understanding.
**This chart analysis is for educational purposes only, and should not be construed as a recommendation to buy, sell or sell-short said securities**
**************************************************************
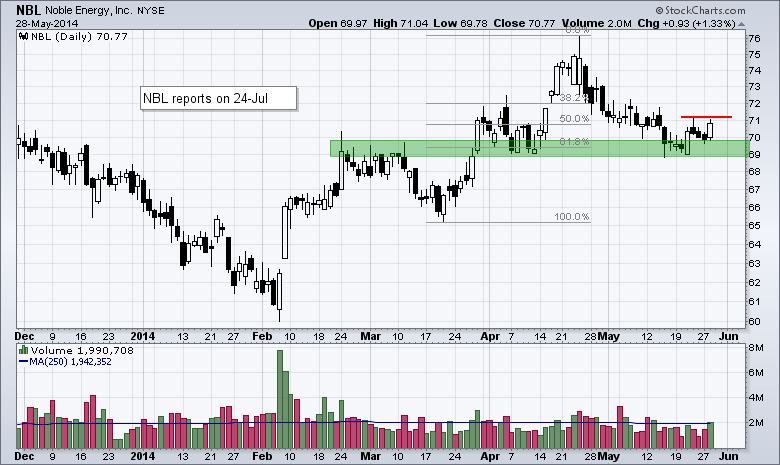
Noble Energy (NBL) is at an interesting juncture as it firms near the 62% retracement. First, note that the bigger trend is up as the stock advanced from the low 60s to the mid 70s. This assumption suggests that the decline over the last six weeks is just a correction. The stock firmed near the 62% retracement and bounced on good volume Wednesday. A break above last week's high would be bullish.
***************************************************************
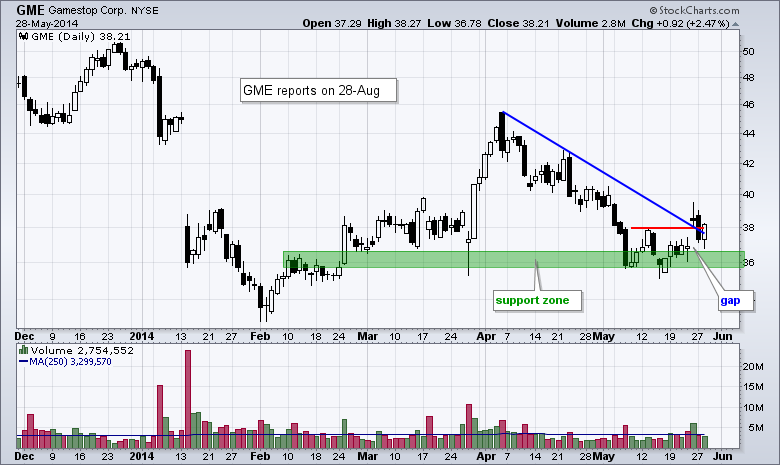
Gamestop (GME) is perking up and this could scare some shorts. Note that this stock has a 27% short interest and a 3.5% dividend. I have no idea how safe the dividend is or the fundamental situation of the company, but the stock is perking up technically. There is support in the 36 area extending back to March. GME broke the April trend line and mid May high with a gap on Monday. After a pullback on Tuesday, the stock firmed on Wednesday and the gap is holding.
***************************************************************
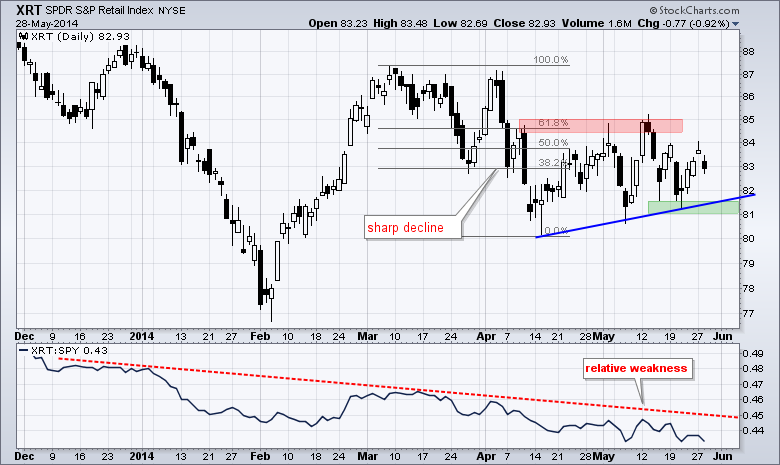
I remained concerned with relative weakness in the Retail SPDR (XRT) as the price relative hit a new low last week. The ETF fell sharply in early April and rebounded with a choppy advance. The April trend line and late May lows mark key support in the 81-81.5 area. A break below this support zone would be quite negative for the retail group, the consumer discretionary sector and the market.
***************************************************************
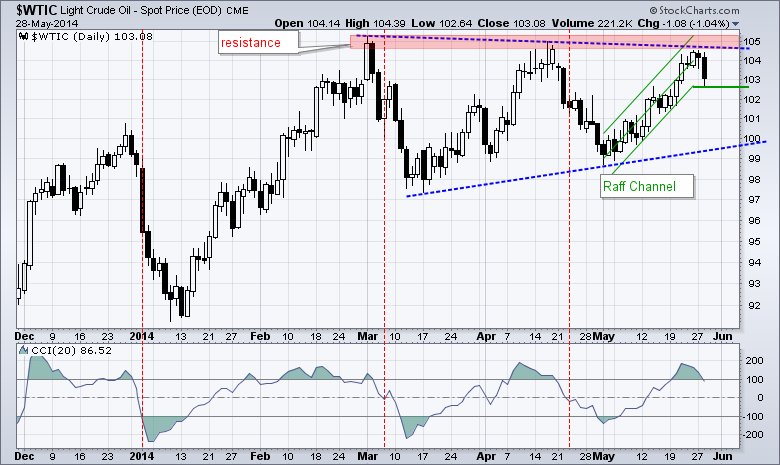
Spot Light Crude ($WTIC) hit resistance from the March-April highs and fell back over the last two days. The four week swing remains up with the Raff Channel marking support at 102.6. The Commodity Channel Index (CCI) dipped below -100, but has a bullish bias as long as it remains positive. A break below zero would turn momentum bearish.
***************************************************************
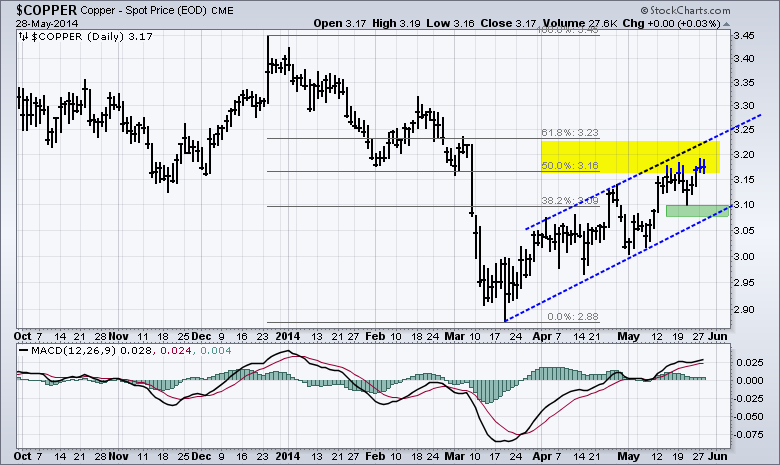
Spot Copper ($COPPER) is at an interesting juncture after a two month bounce. First, the long-term trend for copper is down. Second, the current advance retraced 50-62% of the prior decline. Third, a rising channel formed. Even though this looks like a classic corrective bounce, the immediate trend is up as long as the channel rises. A break below the green support zone would reverse this uptrend and signal continuation of the prior decline.
***************************************************************
This commentary and charts-of-interest are designed to stimulate thinking. This analysis is not a recommendation to buy, sell, hold or sell short any security (stock ETF or otherwise). We all need to think for ourselves when it comes to trading our own accounts. First, it is the only way to really learn. Second, we are the only ones responsible for our decisions. Think of these charts as food for further analysis. Before making a trade, it is important to have a plan. Plan the trade and trade the plan. Among other things, this includes setting a trigger level, a target area and a stop-loss level. It is also important to plan for three possible price movements: advance, decline or sideways. Have a plan for all three scenarios BEFORE making the trade. Consider possible holding times. And finally, look at overall market conditions and sector/industry performance.


