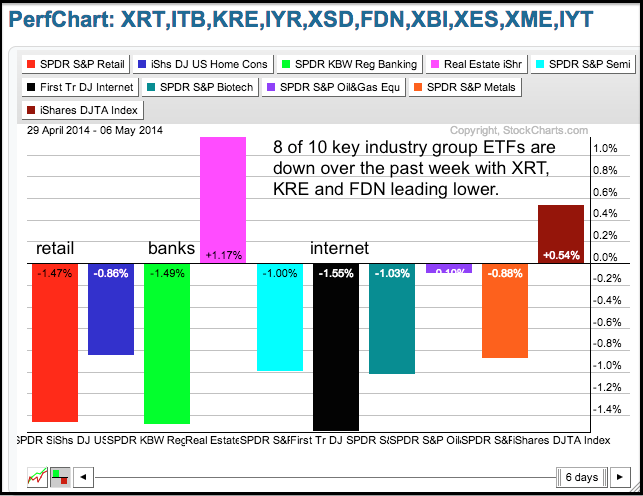
After opening weak and recovering on Monday, stocks opened slightly lower and declined on Tuesday. I consider a weak open and steady decline more negative because it suggests consistent selling pressure. The Russell 2000 ETF (IWM) and Russell MicroCap iShares (IWC) led the market lower. Relative weakness in small and micro caps indicates a weak appetite for risk right now. Among the sectors, the Finance SPDR (XLF) and the Consumer Discretionary SPDR (XLY) led the market lower. Relative weakness in finance and consumer discretionary is clearly a negative for the stock market. Also note that the Internet ETF (FDN) was hammered again with a 3% loss and Groupon (GRPN) got hit after hours. Money continues to move out of the speculative end of the market. Selling pressure is carrying over to Asia as the Nikkei fell around 3% and the Hang Seng declined 1%. The PerfChart below shows the Retail SPDR (XRT), Regional Bank SPDR (KRE) and Internet ETF (FDN) leading the industry group ETFs lower over the past week.
**This chart analysis is for educational purposes only, and should not
be construed as a recommendation to buy, sell or sell-short said securities**
**************************************************************
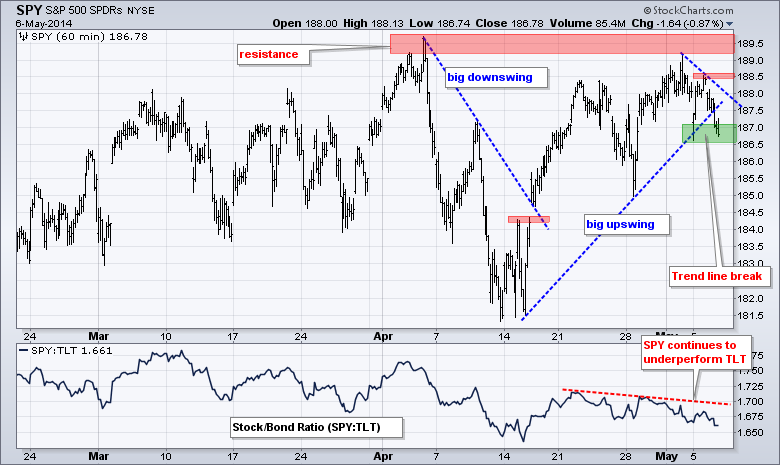
It is time for a redraw on the SPY chart. After moving to new highs in early April, the ETF embarked on two big swings: a downswing from 189.5 to 181.5 and an upswing from 181.5 to 189. The current swing is up, but on the verge of reversing after the trend line break. Monday's low marks short-term support at 186.5 and follow thru below this level would suggest that a downtrend has started. There is clearly some overhead resistance in the 189-189.5 area and SPY continues to underperform TLT, which suggest that money is moving into bonds, not stocks.
**************************************************************
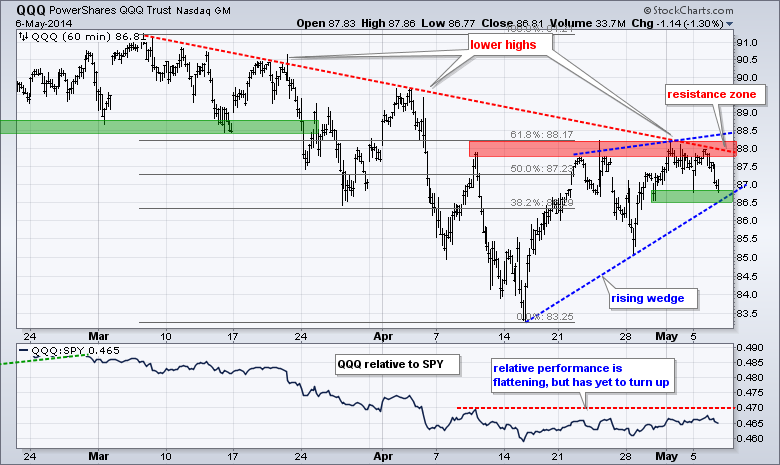
I can still make the case for a short-term uptrend in QQQ, but the rising wedge is looking rather ominous. First, note that the ETF has a series of lower highs working since early March. Second, notice that the rising wedge retraced 62% and met resistance in the 88 area. Third, QQQ did not outperform SPY during the rising wedge advance. QQQ is now testing wedge support and a break below 86.5 would reverse the short-term uptrend.
**************************************************************
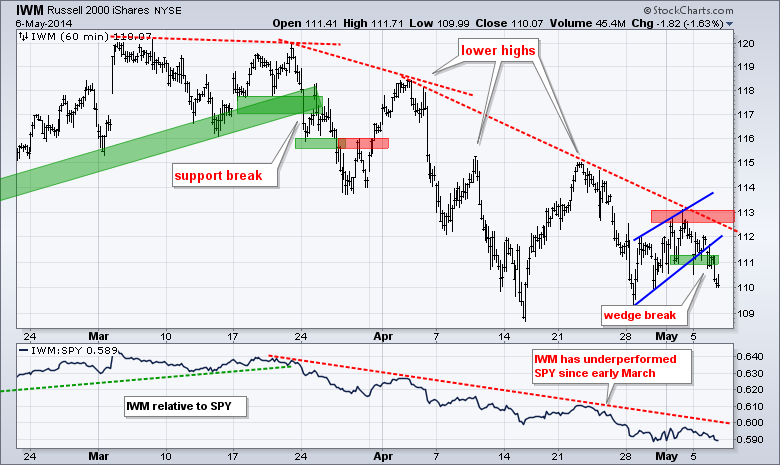
IWM remains in a nine week downtrend and continues to underperform SPY. IWM bounced last week, but formed a bearish wedge and broke wedge support this week. The break signals yet another continuation lower. Chartists can now set key resistance at 113. The indicator window shows the price relative (IWM:SPY ratio) near multi-month lows.
**************************************************************
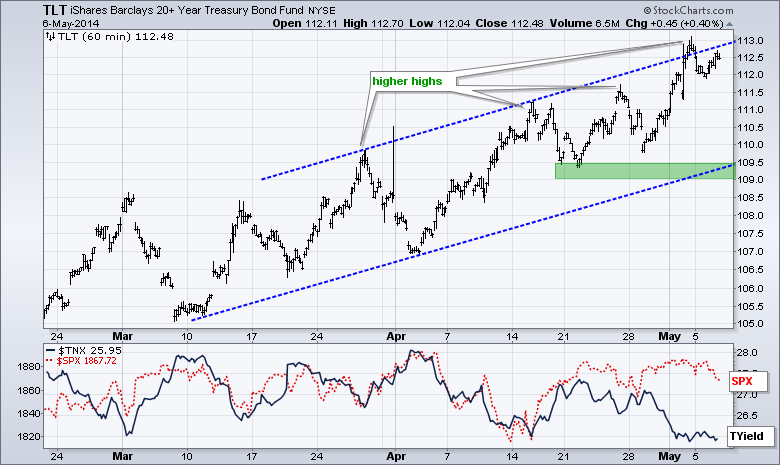
No change. Despite some positive economic reports last week, the 20+ YR T-Bond ETF (TLT) continued higher and finished at a new high for the move. This puts the ETF just above the upper trend line of the rising channel and makes it overbought. The lower trend line and mid April lows combine to mark key support in the 109-109.5 area.
**************************************************************
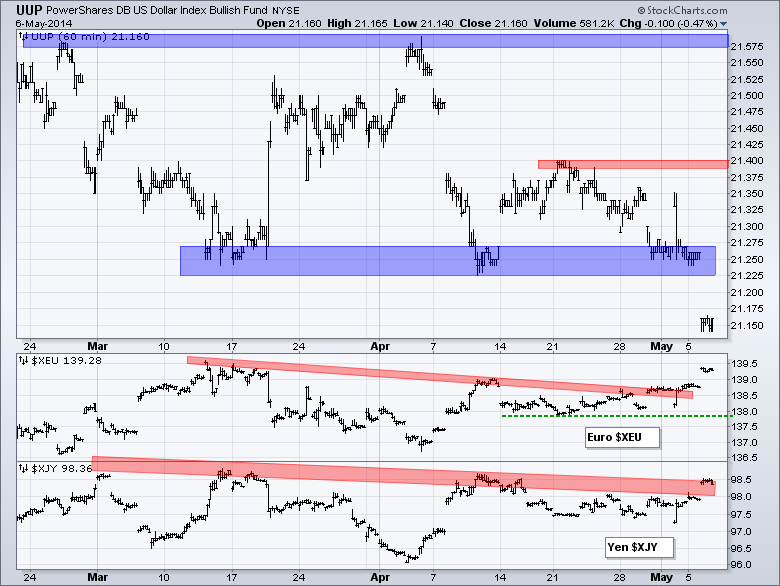
The US Dollar ETF (UUP) broke below its March-April lows to extend its downtrend. Falling US interest rates are weighing on the Dollar. The mid April high becomes resistance in the 21.40 area. The Euro Index ($XEU) broke out this week and chartists can mark support in the 138 area.
**************************************************************
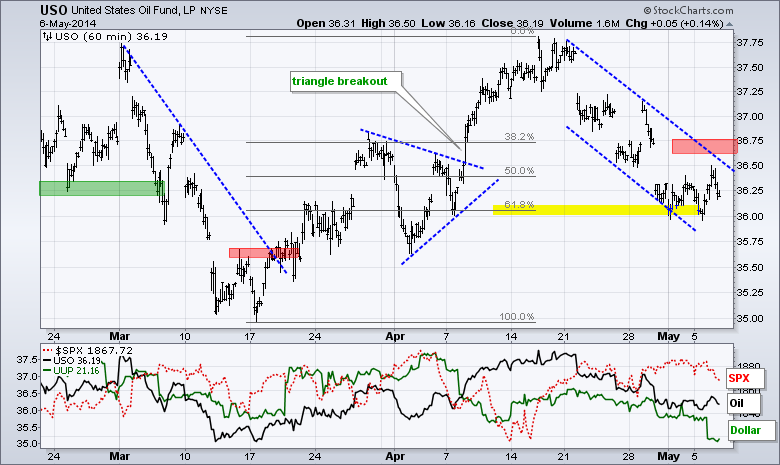
No change. The USO Oil Fund (USO) fell sharply and has now retraced 62% of the advance from mid March to mid April. The bigger trend for oil is up and this is still considered a correction within that uptrend. The falling channel defines this correction and I will mark resistance at 36.75. A break above this level would end the correction and signal a resumption of the bigger uptrend.
**************************************************************
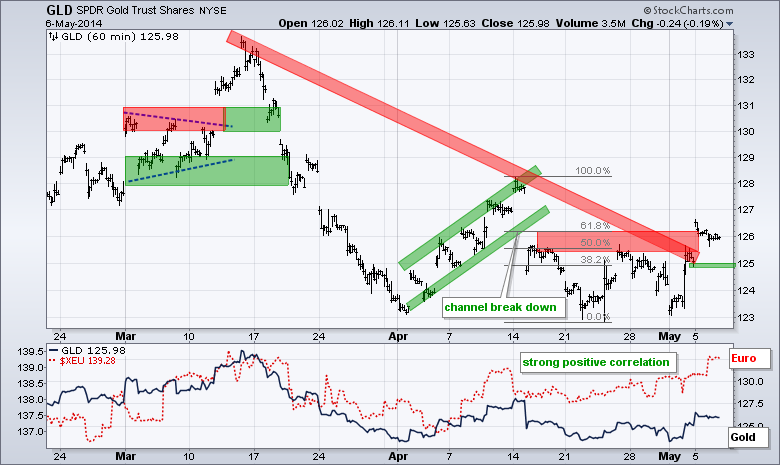
No change. GLD surged on Friday and followed thru on Monday with a break above the late April high and mid March trend line. The move is certainly positive from a short-term standpoint, but I am holding out for a break above the mid April high for a more meaningful move. A quick move back below 124.8 would negate this breakout and put the short-term downtrend back in play.
***************************************************************
Key Reports and Events (all times Eastern):
Wed - May 07 - 07:00 - MBA Mortgage Index
Wed - May 07 - 10:30 - Crude Oil Inventories
Thu - May 08 - 08:30 - Initial Jobless Claims
Thu - May 08 - 08:30 - European Central Bank (ECB) Policy Statement
Thu - May 08 - 10:30 - Natural Gas Inventories
Fri - May 09 - 10:00 - JOLTS - Job Openings
This commentary and charts-of-interest are designed to stimulate thinking. This analysis is not a recommendation to buy, sell, hold or sell short any security (stock ETF or otherwise). We all need to think for ourselves when it comes to trading our own accounts. First, it is the only way to really learn. Second, we are the only ones responsible for our decisions. Think of these charts as food for further analysis. Before making a trade, it is important to have a plan. Plan the trade and trade the plan. Among other things, this includes setting a trigger level, a target area and a stop-loss level. It is also important to plan for three possible price movements: advance, decline or sideways. Have a plan for all three scenarios BEFORE making the trade. Consider possible holding times. And finally, look at overall market conditions and sector/industry performance.


