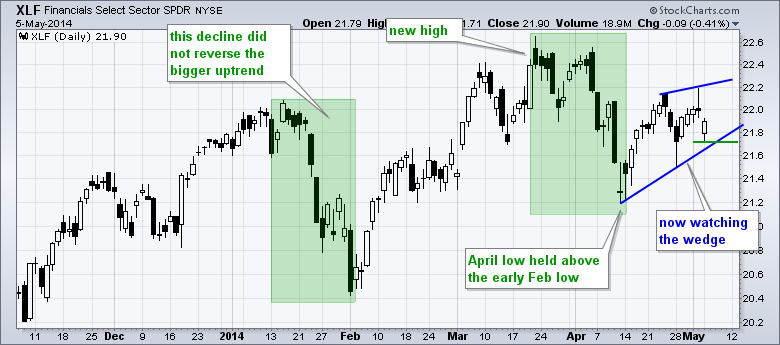
The major index ETFs opened weak, but firmed in the first thirty minutes and bounced to close virtually unchanged. The overall results were mixed with the Nasdaq 100 ETF advancing .53% on the day and the Russell 2000 ETF (IWM) closing .12% lower. Despite mixed results at the end, it was pretty impressive to see the Dow recover from a 135 point deficit. Weakness in banks weighed on the day after JP Morgan warned that trading revenue in the second quarter would be twenty percent lower. This issue is not specific to JP Morgan and will also affect other banks with trading operations, such as Goldman Sachs and Morgan Stanley. This news, however, is already priced into the stocks. Keep this in mind. If you have read it, most everyone else has already read it as well and it is most likely already priced into the stock. The chart below shows the Finance SPDR (XLF) opening below 21.8 and closing at 21.9 to form a small hollow candlestick and affirm wedge support. The short-term trend is up as long as this wedge rises. A close below Monday's low would break wedge support and signal a continuation of the early April decline.
**This chart analysis is for educational purposes only, and should not
be construed as a recommendation to buy, sell or sell-short said securities**
**************************************************************
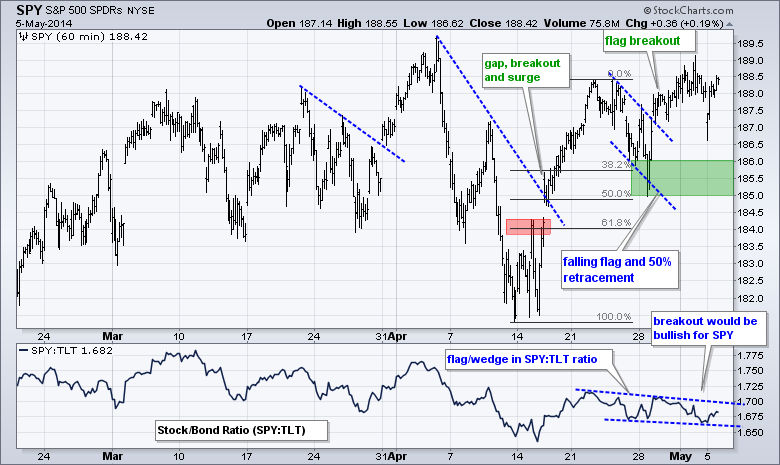
No change. SPY surged from 181 to 188.5 in mid April, corrected with a falling flag and then broke flag resistance last week. The breakout is holding and broken resistance in the 187-187.5 turns first support to watch for a failed breakout. The flag lows mark key support in the 185-186 area. The indicator window shows the SPY:TLT ratio falling over the last two weeks as SPY underperforms TLT, which hit a new high last week. Relative weakness in SPY is negative, but a flag/wedge breakout in this ratio would be bullish for stocks.
**************************************************************
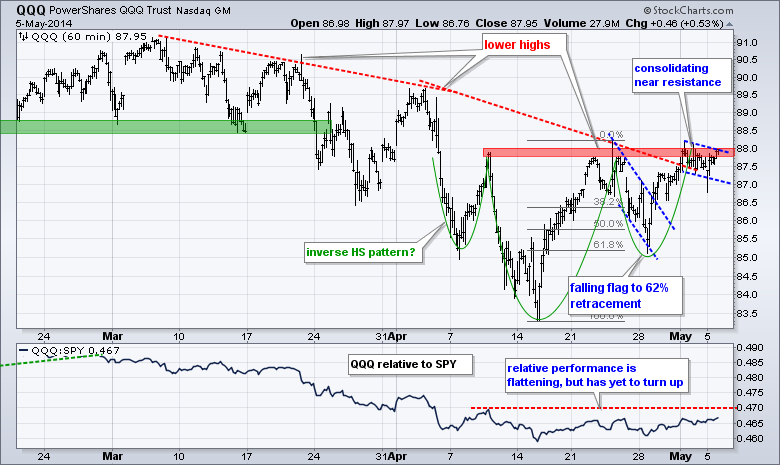
No change. QQQ is trying for a breakout, but continues to have trouble with resistance in the 88 area. Overall, an inverse head-and-shoulders of sorts is taking shape and the ETF broke flag resistance last week. A small flag formed over the last three days and a breakout here would provide another bullish indication. The indicator window shows the QQQ:SPY ratio turning flat as QQQ performs inline with SPY over the last four weeks.
**************************************************************
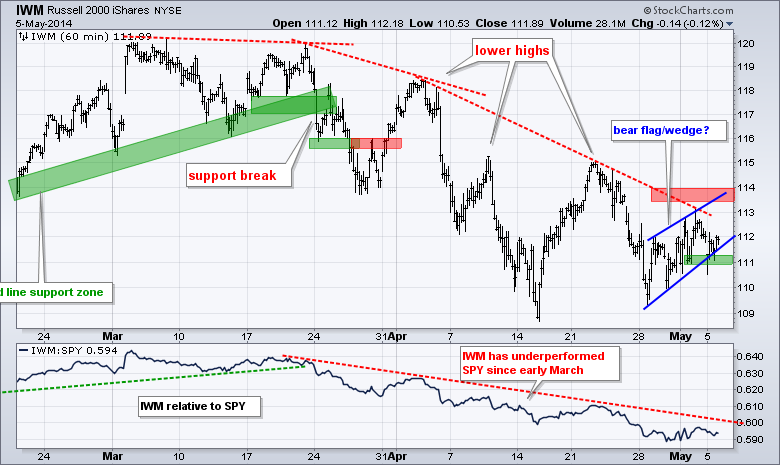
No change. IWM remains in a downtrend and the weakest of the major index ETFs. The ETF did manage to hold above the mid April low and bounce with a rising wedge the last two weeks. Rising wedges, however, are potentially bearish continuation patterns. The bulls have a slight edge as long as the wedge rises. A break below 110.9 would reverse the wedge and signal a continuation of the downtrend. For the overall downtrend, I am leaving key resistance at 114 for IWM.
**************************************************************
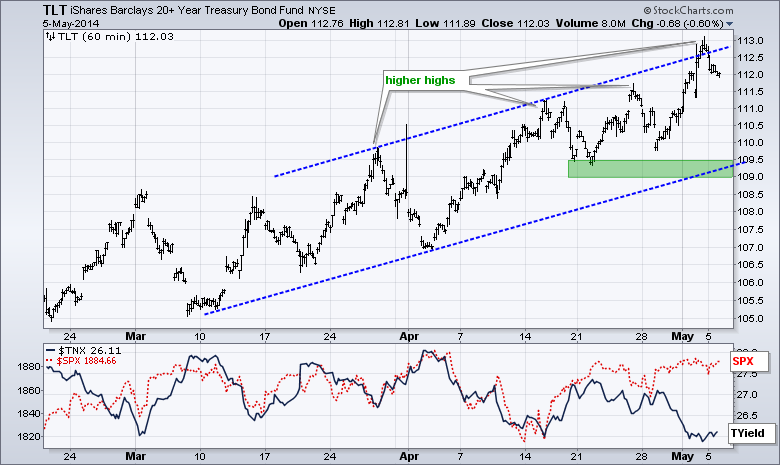
No change. Despite some positive economic reports last week, the 20+ YR T-Bond ETF (TLT) continued higher and finished at a new high for the move. This puts the ETF just above the upper trend line of the rising channel and makes it overbought. The lower trend line and mid April lows combine to mark key support in the 109-109.5 area.
**************************************************************
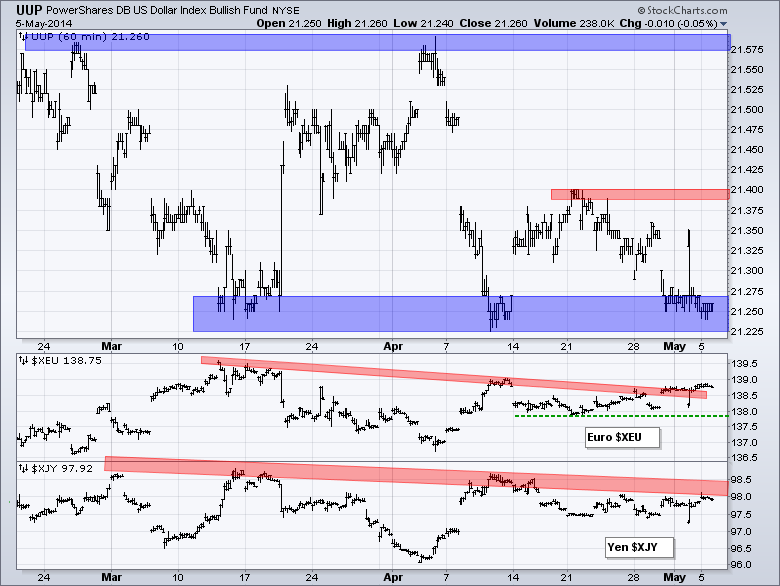
No change. The US Dollar ETF (UUP) surged on the open Friday, but fell back to support and closed near support. The bigger trend for the Dollar is down and a break would signal a continuation lower. The late April highs mark resistance at 21.40. The Euro Index ($XEU) opened weak and closed strong. The move was enough to break the mid March trend line zone and the Euro is acting like it wants to move higher. The European Central Bank (ECB) meets on Thursday and there are no signs that Draghi is ready to embark on QE for the EU.
**************************************************************
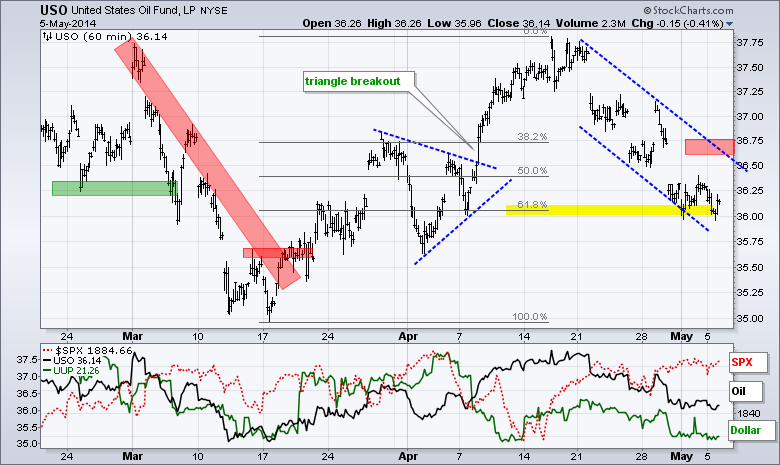
No change. The USO Oil Fund (USO) fell sharply and has now retraced 62% of the advance from mid March to mid April. The bigger trend for oil is up and this is still considered a correction within that uptrend. The falling channel defines this correction and I will mark resistance at 36.75. A break above this level would end the correction and signal a resumption of the bigger uptrend.
**************************************************************
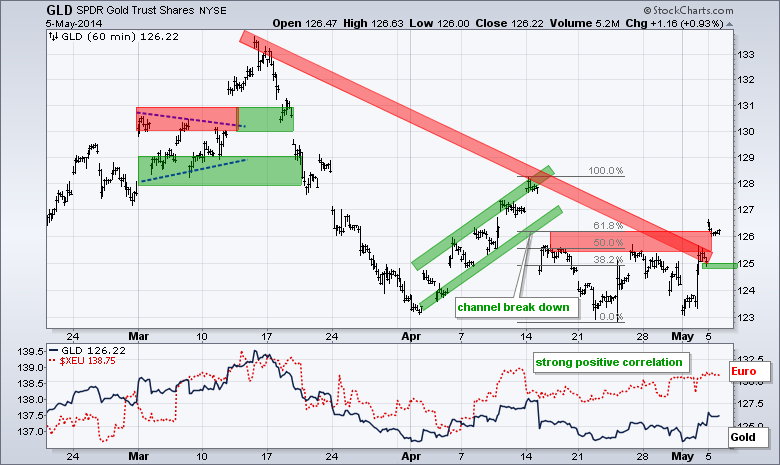
GLD surged on Friday and followed thru on Monday with a break above the late April high and mid March trend line. The move is certainly positive from a short-term standpoint, but I am holding out for a break above the mid April high for a more meaningful move. A quick move back below 124.8 would negate this breakout and put the short-term downtrend back in play.
***************************************************************
Key Reports and Events (all times Eastern):
Wed - May 07 - 07:00 - MBA Mortgage Index
Wed - May 07 - 10:30 - Crude Oil Inventories
Thu - May 08 - 08:30 - Initial Jobless Claims
Thu - May 08 - 08:30 - European Central Bank (ECB) Policy Statement
Thu - May 08 - 10:30 - Natural Gas Inventories
Fri - May 09 - 10:00 - JOLTS - Job Openings
This commentary and charts-of-interest are designed to stimulate thinking. This analysis is not a recommendation to buy, sell, hold or sell short any security (stock ETF or otherwise). We all need to think for ourselves when it comes to trading our own accounts. First, it is the only way to really learn. Second, we are the only ones responsible for our decisions. Think of these charts as food for further analysis. Before making a trade, it is important to have a plan. Plan the trade and trade the plan. Among other things, this includes setting a trigger level, a target area and a stop-loss level. It is also important to plan for three possible price movements: advance, decline or sideways. Have a plan for all three scenarios BEFORE making the trade. Consider possible holding times. And finally, look at overall market conditions and sector/industry performance.


