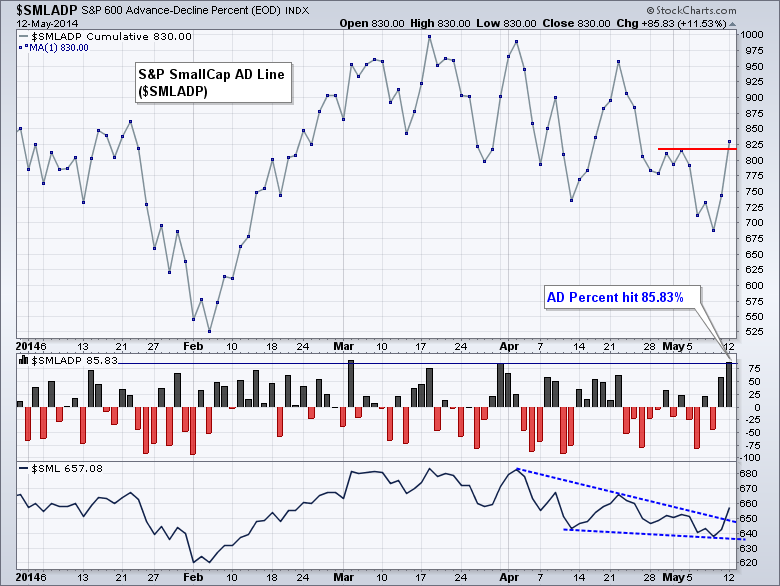
Stocks surged with a broad-based rally led by small-caps. The Russell 2000 ETF and the Russell MicroCap iShares gained over 2%, while the Dow Diamonds and S&P 500 SPDR gained less than 1%. It was a lopsided rally, but a little relative strength in small-caps is positive overall. It is also positive to see the 10-YR Treasury Yield ($TNX) rising and stocks starting to outperform Treasuries. Retail sales will be reported before the open and a strong report would further weigh on Treasuries. Eight of the nine sectors were up with industrials, technology, materials and consumer discretionary leading. Utilities lost ground as money moved out of defensive sectors. Strength in small-caps can be seen in the AD Line for the S&P SmallCap 600 ($SMLADP), which surged to its highest level of the month. Also notice that AD Percent surged above 80% for the first time since early March. An upside breadth thrust after a decline is positive and could foreshadow further strength in small-caps.
**This chart analysis is for educational purposes only, and should not
be construed as a recommendation to buy, sell or sell-short said securities**
**************************************************************
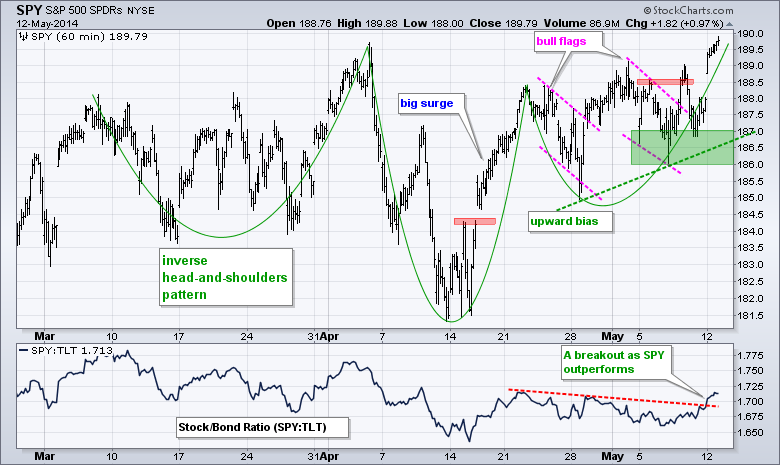
SPY gapped up and surged to a new high on Monday. First, the gap is bullish. Second, prices continued higher after the gap. After the big April surge, SPY is simply zigzagging higher and the trend here is clearly up. The May lows combine to mark key support in the 186-187 area. The indicator window shows the SPY:TLT ratio breaking out as stocks start outperforming bonds.
**************************************************************
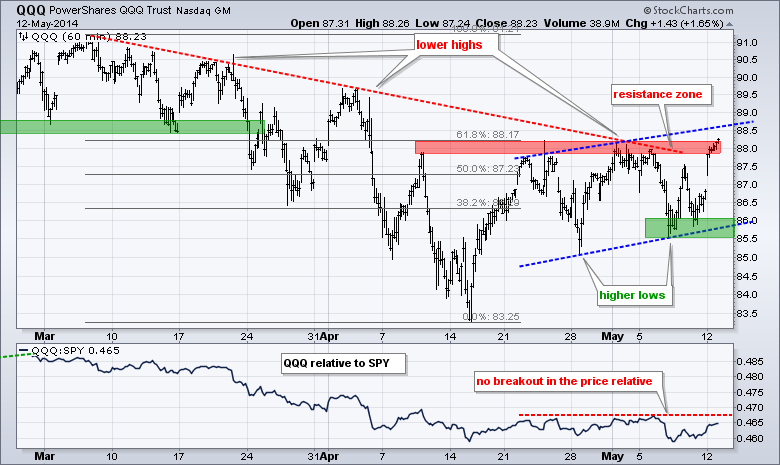
QQQ found support in the 86 area and surged to resistance with a gap. There is a choppy uptrend working the last few weeks with higher lows and higher highs. The break above resistance at 88 affirms this uptrend with a higher high. The early May lows mark key support in the 85.5-86 area.
**************************************************************
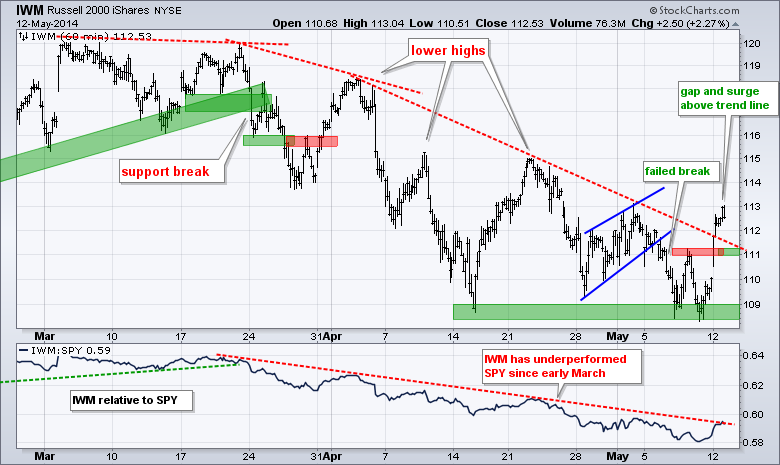
IWM found support in the 109 area and surged above 112 with a gap. Not only did the ETF gap up, but it also continued higher after the gap and broke the early April trend line. I will treat this gap-surge as a bullish breakout as long as it holds. A move back below 110.9 would suggest a failure and call for a reassessment.
**************************************************************
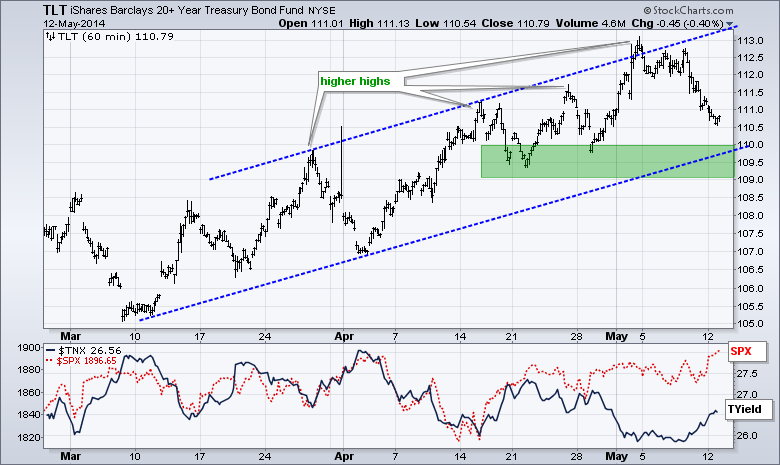
The 20+ YR T-Bond ETF (TLT) fell sharply over the last few days and this facilitated the rally in stocks. The trend remains up since mid March with support marked in the 109-110 area. The bond market will be on the hot seat today because retail sales will be reported before the open. A strong report would be positive for the economy and weigh further on Treasuries.
**************************************************************
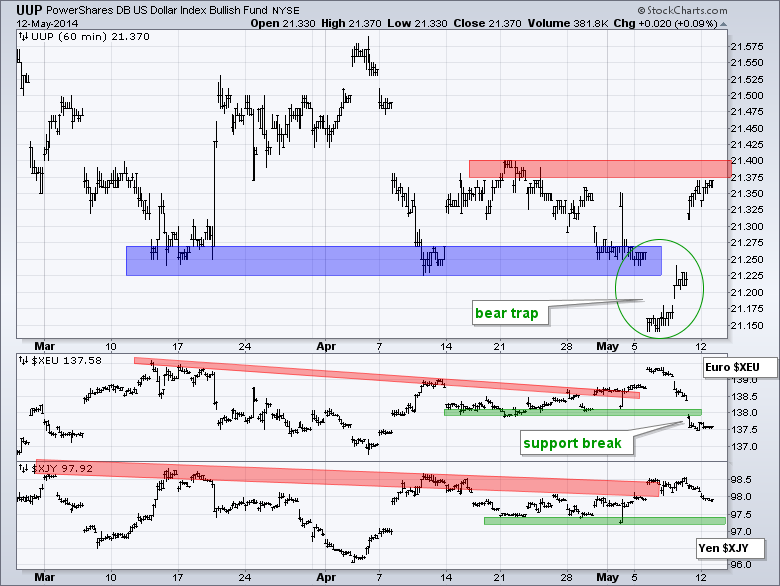
No change. The US Dollar ETF (UUP) broke support, but this support break did not hold as the ETF surged back above the 21.3 area on Friday. This is a bear trap. Also notice that the Euro Index ($XEU) did not hold its breakout and fell below support at 138. The combination is Dollar bullish and Euro bearish. UUP has one more resistance level in the way (21.4) and a breakout here would complete the reversal.
**************************************************************
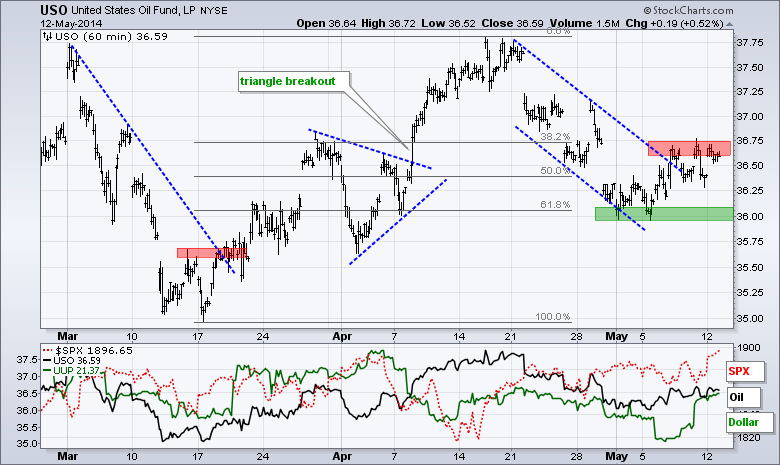
No change. The USO Oil Fund (USO) retraced 62% of the prior advance with a falling channel and broke above the upper trend line last week. Oil traded choppy after the breakout as USO stalled in the 36.5 area on Thursday-Friday. A follow through above 36.75 would complete the breakout and argue for a continuation of the March-April advance.
**************************************************************
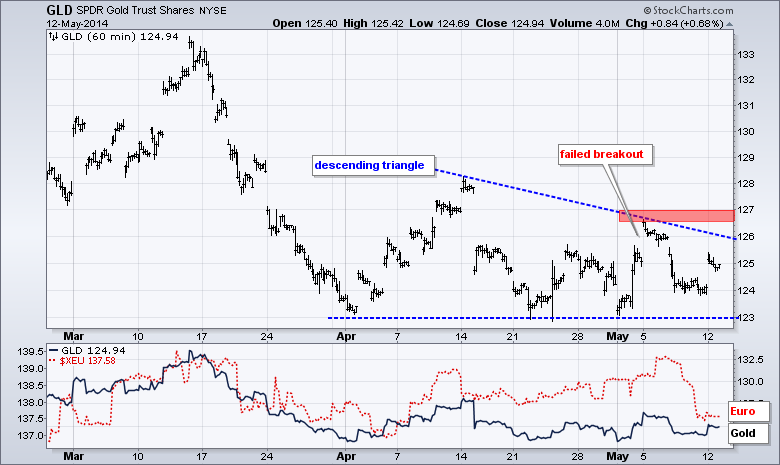
No change. Gold could not break above 128 when tensions were running high in Ukraine. Further more, the Dollar remains weak and gold formed a lower high just below 127. The bigger trend for gold is down and is looks like GLD is forming a bearish descending triangle. A move below 123 would signal a continuation lower and target a move to the 118 area.
***************************************************************
Key Reports and Events (all times Eastern):
Tue - May 13 - 08:30 - Retail Sales
Tue - May 13 - 10:00 - Business Inventories
Wed - May 14 - 07:00 - MBA Mortgage Index
Wed - May 14 - 08:30 - Producer Price Index (PPI)
Wed - May 14 - 10:30 - Crude Oil Inventories
Thu - May 15 - 08:30 - Initial Jobless Claims
Thu - May 15 - 08:30 - Consumer Price Index (CPI)
Thu - May 15 - 08:30 - Empire State Manufacturing
Thu - May 15 - 09:15 - Industrial Production
Thu - May 15 - 10:00 - Philadelphia Fed Index
Thu - May 15 - 10:00 - NAHB Housing Market Index
Thu - May 15 - 10:30 - Natural Gas Inventories
Fri - May 16 - 08:30 - Housing Starts/Building Permits
Fri - May 16 - 09:55 - Michigan Sentiment
This commentary and charts-of-interest are designed to stimulate thinking. This analysis is not a recommendation to buy, sell, hold or sell short any security (stock ETF or otherwise). We all need to think for ourselves when it comes to trading our own accounts. First, it is the only way to really learn. Second, we are the only ones responsible for our decisions. Think of these charts as food for further analysis. Before making a trade, it is important to have a plan. Plan the trade and trade the plan. Among other things, this includes setting a trigger level, a target area and a stop-loss level. It is also important to plan for three possible price movements: advance, decline or sideways. Have a plan for all three scenarios BEFORE making the trade. Consider possible holding times. And finally, look at overall market conditions and sector/industry performance.


